Differential Expression
Pseudobulking
Expression values are aggregated for each embryo each cell into "pseudo-cells".
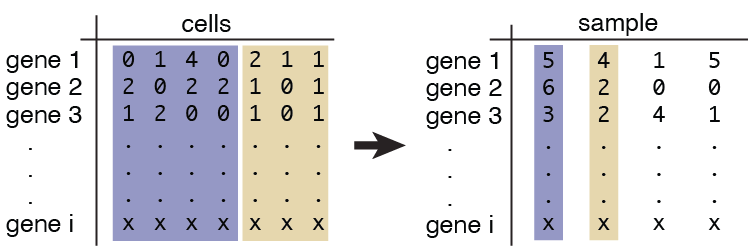
The aggregation matches that of the ccs.
ccs- a Hookecell_count_setobject.
pb_cds = pseudobulk_ccs_for_states(ccs)
To add a column from the colData(ccs), use the add_covariate() function. It requires three inputs:
ccs- a Hookecell_count_setobject.pb_cds- a pseudobulked-cds frompseudobulk_ccs_for_states.covariate- a column to add from thecolData(ccs).
# this covariate we are adding will be required for our future model formula
pb_cds = add_covariate(ccs, pb_cds, "exposed")
Finding top markers
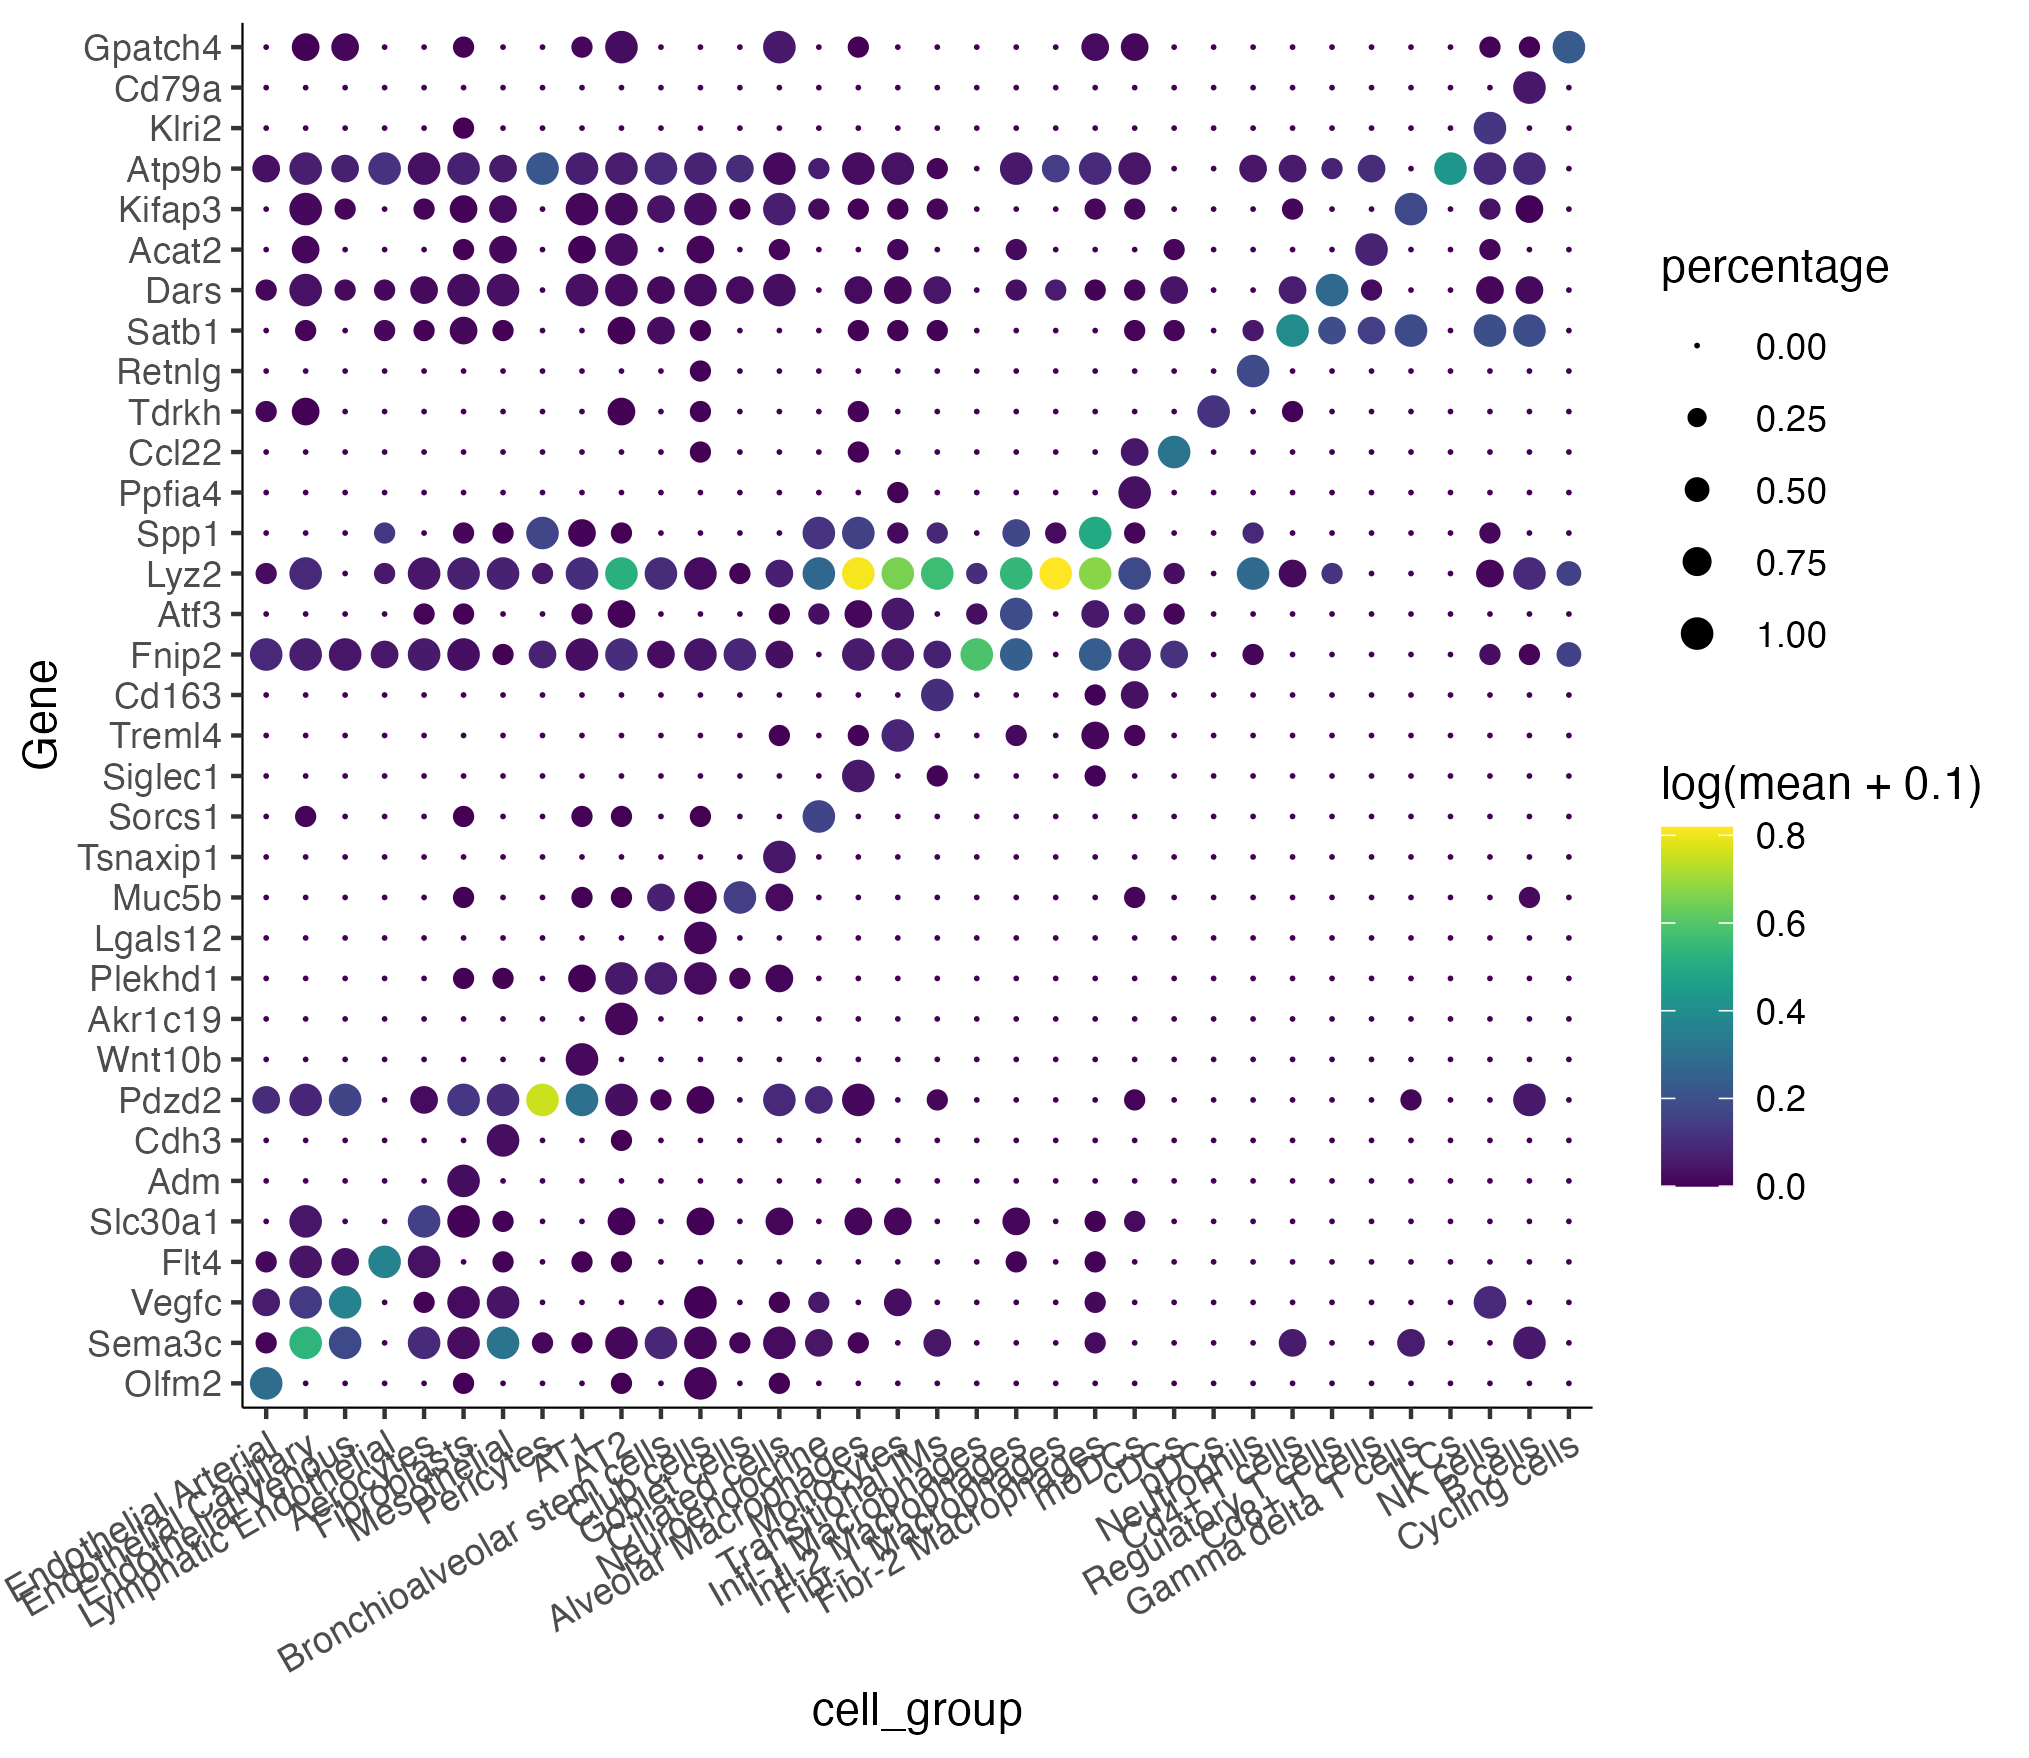
We can identify top markers for each cell type in the ccs. See the monocle3 website for more in-depth documentation on how to use top_markers().
# subset to control cells only
wt_pb_cds = pb_cds[, colData(pb_cds)$perturbation == "not exposed"]

marker_test_res = top_markers(wt_pb_cds, group_cells_by = "cell_group")

top_specific_markers <- marker_test_res %>%
  filter(fraction_expressing >= 0.10) %>%
  group_by(cell_group) %>%
  top_n(1, pseudo_R2)

top_specific_marker_ids <- unique(top_specific_markers %>% pull(gene_id))

plot_genes_by_group(wt_pb_cds,
                    top_specific_marker_ids,
                    group_cells_by="cell_group",
                    ordering_type="maximal_on_diag",
                    max.size=3)
Running fit models
Monocle3's fit_models() accepts a weights argument via ..., which we set to the number of cells in each group. This allows the number of observations to reflect the number of cells, not just the number of pseudobulks. Here, we test one cell type that came up as significantly differentially abundant, Fibr-2 Macrophages. See the monocle3 website for more in-depth documentation on how to use fit_models().
# subset the pseudobulked cds to one cell type
fm_pb_cds = pb_cds[, colData(pb_cds)$cell_group %in% c("Fibr-2 Macrophages")]

# test for differentially expressed genes between silica exposed and control Fibr-2 macrophages
gene_fits <- monocle3::fit_models(fm_pb_cds,
                        model_formula_str = "~exposed",
                        weights=colData(fm_pb_cds)$num_cells_in_group)

fit_coefs <- coefficient_table(gene_fits)

FM_genes = fit_coefs %>%
              filter(grepl("exposed", term)) %>%
              filter (q_value < 0.05) %>%
              select(gene_short_name, term, q_value, estimate) %>%
              pull(gene_short_name)


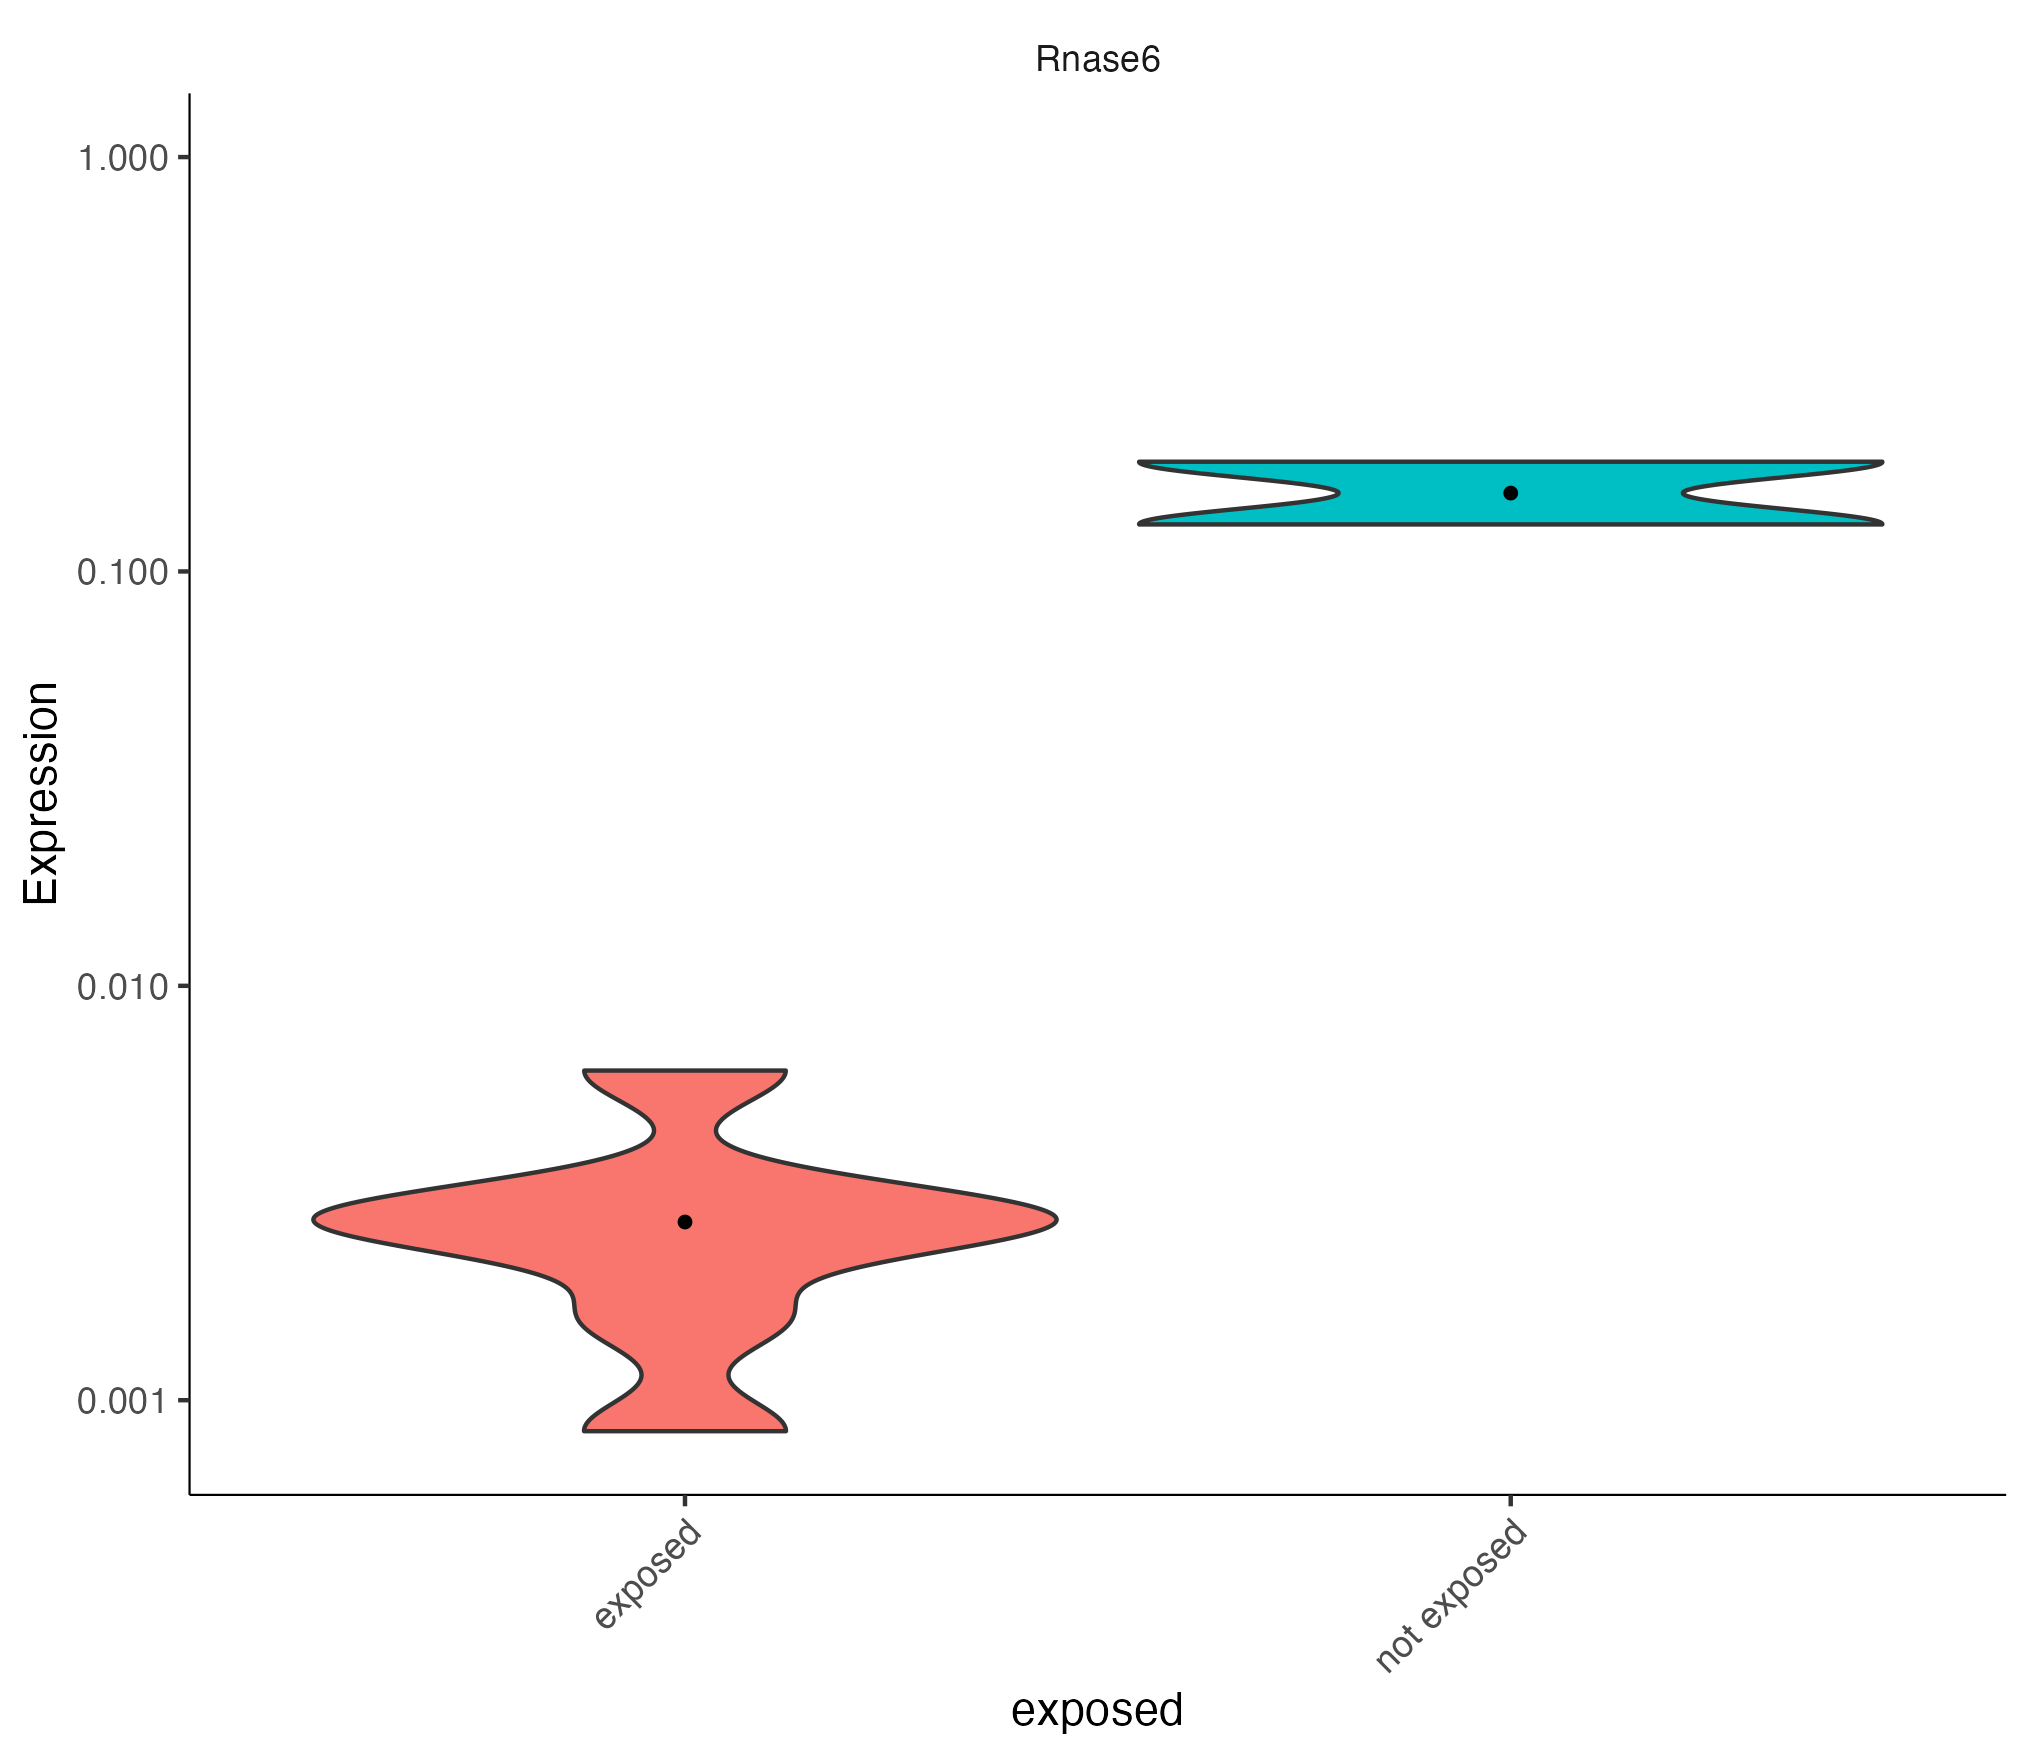
plot_genes_violin(fm_pb_cds[rowData(fm_pb_cds)$gene_short_name %in% FM_genes,],
                  group_cells_by="perturbation", ncol=length(FM_genes)) +
  theme(axis.text.x=element_text(angle=45, hjust=1))