Heading
Donec sed odio dui. Etiam porta sem malesuada magna mollis euismod. Nullam id dolor id nibh ultricies vehicula ut id elit. Morbi leo risus, porta ac consectetur ac, vestibulum at eros. Praesent commodo cursus magna.
Heading
Duis mollis, est non commodo luctus, nisi erat porttitor ligula, eget lacinia odio sem nec elit. Cras mattis consectetur purus sit amet fermentum. Fusce dapibus, tellus ac cursus commodo, tortor mauris condimentum nibh.
Heading
Donec sed odio dui. Cras justo odio, dapibus ac facilisis in, egestas eget quam. Vestibulum id ligula porta felis euismod semper. Fusce dapibus, tellus ac cursus commodo, tortor mauris condimentum nibh, ut fermentum massa justo sit amet risus.
Classify and count cells. See for yourself.
Single-cell RNA-Seq experiments allow you to discover (and possibly rare) subtypes of cells. Monocle helps you identify them.
Most single-cell RNA-Seq protocols capture only a small percentage of the mRNA in each cell, which leads to so-called "drop outs", where mRNAs that are probably present just aren't detected. This makes it hard to determine how many cells of each type there are in your experiment. Monocle has a machine-learning based algorithm for classifying cells by type even in the face of missing data, and even when your cells have been treated in different ways or collected from varying conditions. You can use it to track population dynamics, measure responses to perturbation, and even discover new cell types.
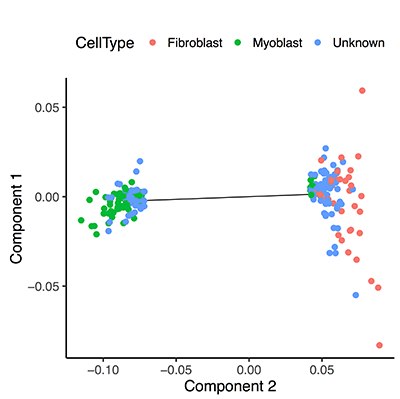
In the plot above, we can recognize some cells as fibroblasts and others as myoblasts on the basis of a few key marker genes. Even though these markers drop-out in many cells, Monocle 2 can still identify cells that lack them by clustering all the cells together based on global expression profile.
Compare cell populations through differential expression. It'll blow your mind.
Single-cell RNA-Seq promises to unveil new cell types and new functional states for known ones. Characterizing new cell types and states begins with comparing them to other, better understood cells. Monocle includes a sophisticated but easy-to-use system for differential expression.
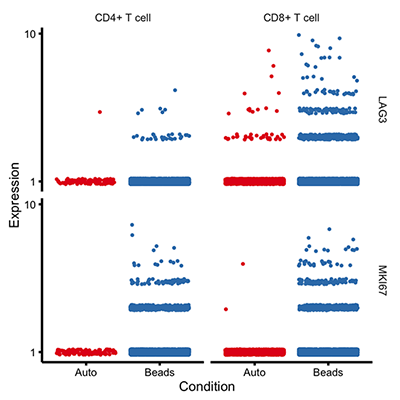
Monocle allows you to compare groups of cells to identify genes that differ between them, even after controlling for other variables in the experiment. For example, the plot above shows genes that differ between two conditions, but only one of them, LAG3, is **also** different between cell types, even after subtracting the other effects. You can use Monocle's differential expression system to zero in on the genes that are most relevant in your experiment.
Identify new marker genes. Checkmate.
Many researchers are using single-cell RNA-Seq to discover new cell types. Monocle can help you purify them or characterize them further by identifying key marker genes that you can use in follow up experiments such as immunofluorescence or flow sorting.
Monocle leverages its differential analysis procedures so you can be assured of the statistical robustness of your marker panel, leading to reliable downstream analysis.
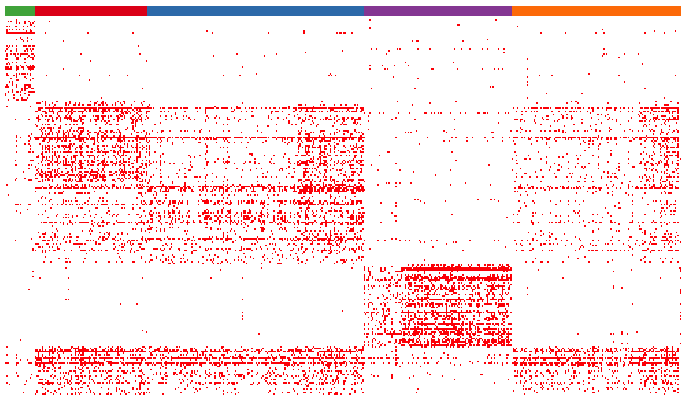
In the plot above, Monocle has identified the top 20 most cell-type specific genes for some of the major lymphocytes in peripheral blood.
Robustly track changes over (pseudo) time. It'll blow your mind.
In development, disease, and throughout life, cells transition from one state to another. Monocle helps you discover these transitions.
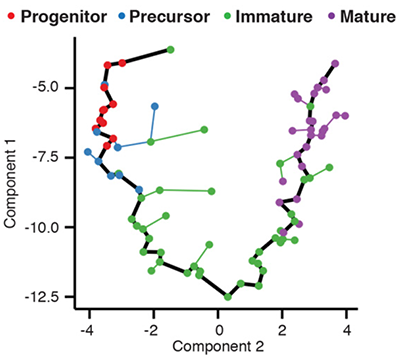
Monocle introduced the concept of **pseudotime**, which is a measure of how far a cell has moved through biological progress. Monocle uses machine learning to reconstruct the sequence of gene regulatory changes each cell must execute as it transitions from one state to another. It can do so without knowing ahead of time which genes define these states or movement between them. After it learns the transition path, or *trajectory*, it places each cell at the correct position along it.
The plot above shows the transcriptional trajectory from developing [olfactory neurons](http://science.sciencemag.org/content/350/6265/1251). (Hanchate et al, Science, 2015).
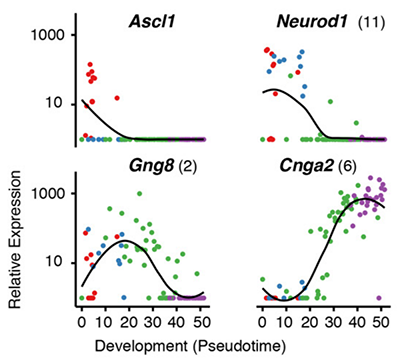
Essentially, Monocle treats each cell as a separate time point in an ultra-high resolution time series. Instead of three or four time points, you get three or four thousand - one for each cell in the experiment. This resolution allows you distinguish genes regulated early in a complex cascade of transcriptional changes from those more downstream. For example, in the plot above you can see that Neurod1 is downregulated before cells enter an immature neuronal state, after which Gng8 is upregulated. As the cells reach maturity, Cnga2 becomes highly expressed.
Monocle 2 includes a vastly improved algorithm for learning trajectories and ordering cells. It's based on a recently introduced technique called [reverse graph embedding](http://dl.acm.org/citation.cfm?id=2783309) (Mao et al, KDD 15), a highly scalable nonlinear manifold learning technique.
Dissect cellular decisions with branch analysis. Checkmate.
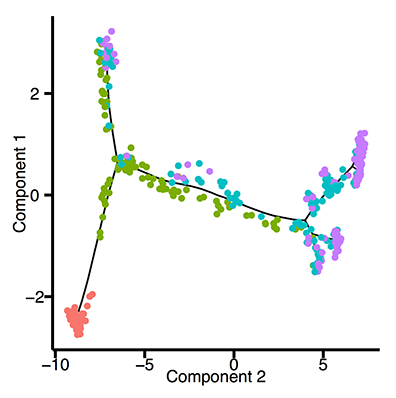
Single-cell trajectory analysis not only exposes transient events as cells move from one state to another. It reveals how cells choose between one of several possible end states. For example, in development, multipotent cells make fate choices, ultimately differentiating into one of a number of terminal cell types. The new reconstruction algorithms introduced in Monocle 2 can robustly reveal branching trajectories. Inspecting the branch points helps you dissect the gene regulatory circuits that cells use to navigate these decisions.
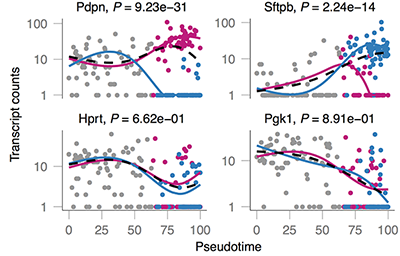
Here, you can see cells that start at a common state (shown in pink) and move through a branched trajectory to one of several functionally distinct outcomes. Which genes are affected at the branches? Monocle 2 includes a new statistical procedure, called Branched Expression Analysis Modeling (BEAM), that reports all genes that change around a selected branch. BEAM can be used to track genes along two lineages in parallel from both a **global** perspective:
