Below are a few examples on how to use Monocle to analyze particular datasets
Olsson Dataset Analysis
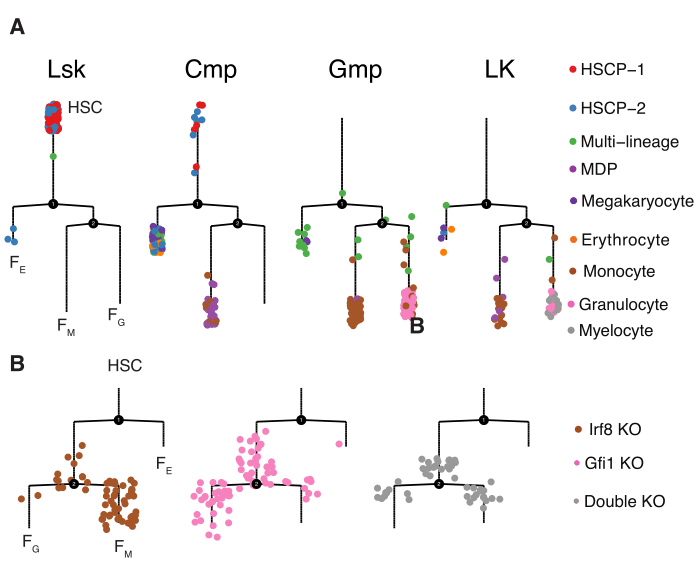
In this tutorial, we demonstrate how to use reversed graph embedding (RGE) in Monocle 2 to resolve the complicated haematopoiesis process which involves two major branch points. In regards to the branch points, HSC bifurcates into either megakaryote/erythroid progenitor (MEP) or granulocyte/monocyte progenitor (GMP) and the bifurcation from GMP into either granulocyte and monocyte progenitor. The reconstructed developmental trajectory is learned in four dimensions but can be visualized in two dimensions. With the trajectory learned, we are able to identify genes showing significant a bifurcation pattern during each lineage bifurcation through BEAM. We can further combine ChIP-seq datasets and Irf8 (monocyte master regulator) for Gfi1 (granulocyte master regulator) as well as the transcription factors to build a regulatory network from master regulators to other important downstream regulators and then those regulators to their downstream targets. This network hierarchy is promising to resolve the fundamental regulatory mechanism for the hematopoiesis. We also provided a multi-way heatmap and multi-way kinetic curves to visualize important marker genes over the differentiation process. Some additional analyses are included, which are used for the tutorial on analyzing the Paul dataset.
Paul Dataset Analysis
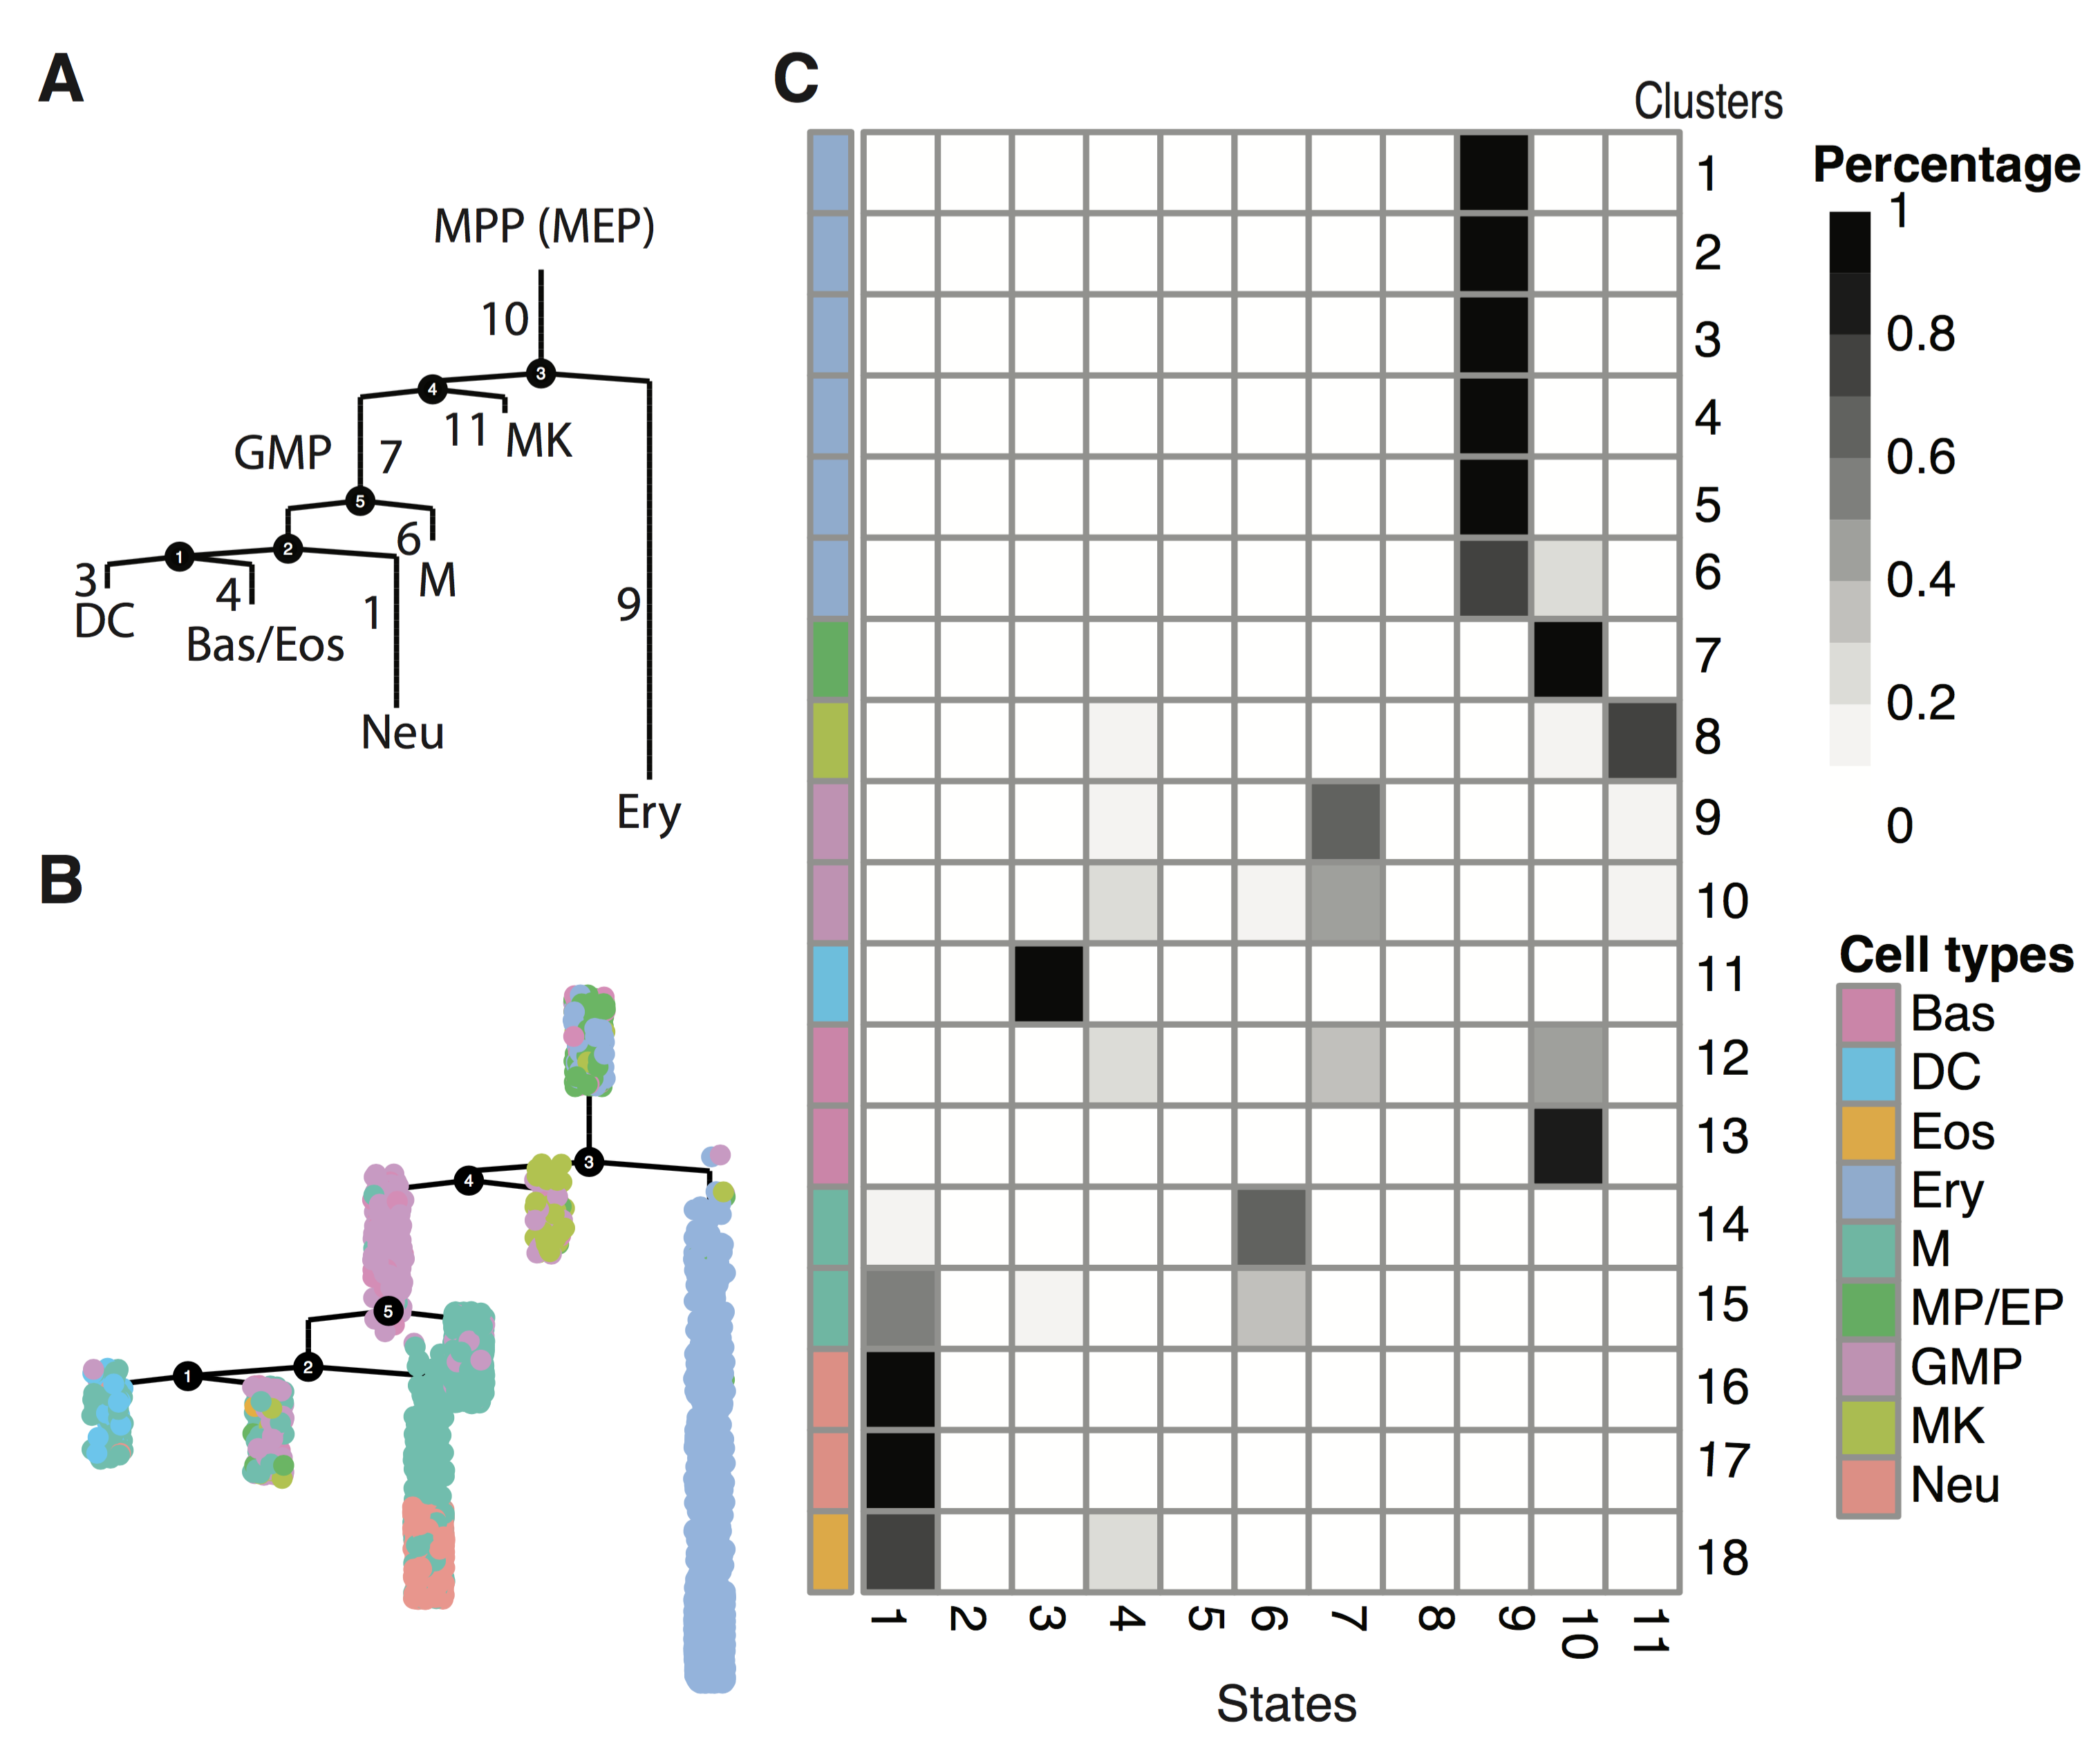
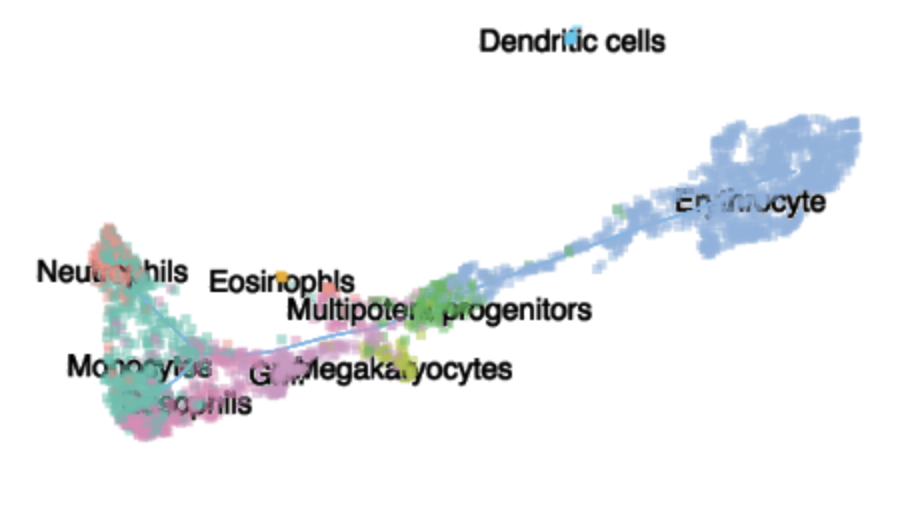
In this tutorial, we demonstrate how to use Monocle 2 to resolve the complicated haematopoiesis process that contains five branch points by applying reversed graph embedding (RGE). To demonstrate this we will be analyzing the Paul dataset. The reconstructed developmental trajectory is learned in ten dimensions, selected based on PC variance explained, but can be visualized in two dimensions using a tree layout. We show that the structure of the tree we reconstructed matches well with the cell type assignment from the original paper . When we use genes based on the above Olsson dataset to define stemness or lineage specificity for each cell on the tree, we can see the smooth transition of cell differentation. Multi-way kinetic curves and multi-way heatmaps visualize the dynamics of six different cell fate commitments.
MCA Dataset Analysis Clustering
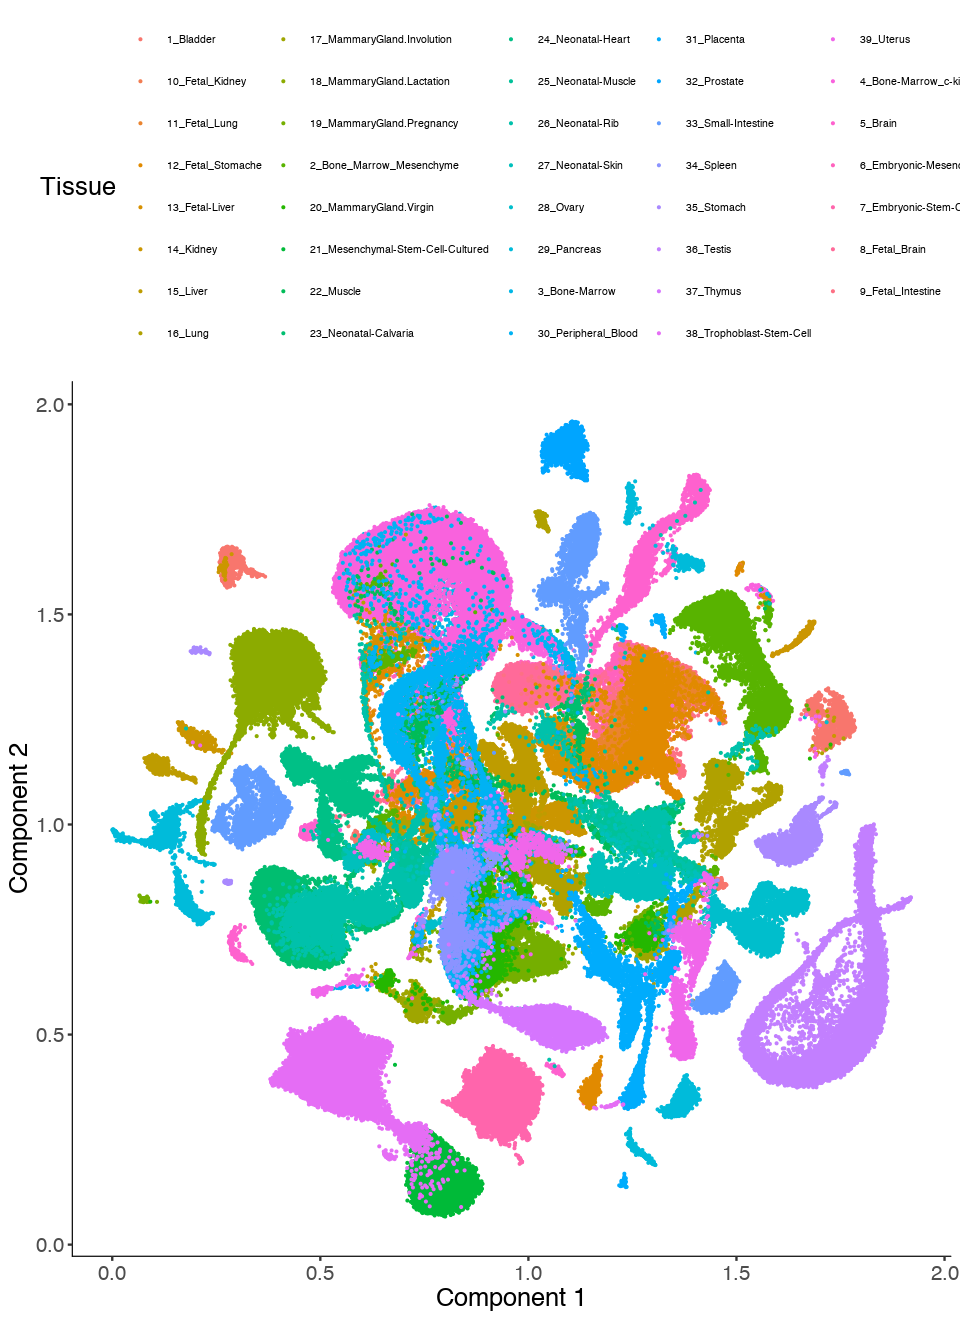
In this tutorial, we demonstrate how to use Monocle 3 (beta version) to cluster cells for very large datasets. We will mainly introduce 1) use delayedarray to facilitate calculations in functions estimateSizeFactor, estimateDispersions and preprocessCDS, etc for large datasets. 2) apply UMAP, a very promising non-linear dimension reduction to learn low dimensional representation of the data. 3) introduce a general differential test (manifoldTest) to identify genes spatially autocorrelated on the low dimensional embedding.