Garnett Documentation for Monocle 3
Monocle or Monocle3?
If you are using Monocle 3
(loading using library(monocle3)), then follow the instructions on this page.
If you are instead using
Monocle or Monocle 2
(loading using library(monocle)), then please follow the instructions
here.
Abstract
Garnett is a software package that faciliates automated cell type classification from single-cell expression data. Garnett works by taking single-cell data, along with a cell type definition (marker) file, and training a regression-based classifier. Once a classifier is trained for a tissue/sample type, it can be applied to classify future datasets from similar tissues. In addition to describing training and classifying functions, this website aims to be a repository of previously trained classifiers.
Installing Garnett
Garnett runs in the R statistical computing environment. You will need R version 3.5 or higher to install Garnett.
Install from Github
To install Garnett directly from the Github repository, use the following instructions:
Garnett builds upon a package called Monocle 3. Before installing Garnett, first install Monocle 3 following the instructions here. Briefly, install Monocle 3 using:
# First install Bioconductor and Monocle 3
if (!requireNamespace("BiocManager"))
    install.packages("BiocManager")

BiocManager::install()

# Next install a few more dependencies
BiocManager::install(c('BiocGenerics', 'DelayedArray', 'DelayedMatrixStats',
                       'limma', 'S4Vectors', 'SingleCellExperiment',
                       'SummarizedExperiment'))

install.packages("devtools")
devtools::install_github('cole-trapnell-lab/monocle3')
You're now ready to install Garnett:
# Install a few Garnett dependencies:
BiocManager::install(c('org.Hs.eg.db', 'org.Mm.eg.db'))

# Install Garnett
devtools::install_github("cole-trapnell-lab/garnett", ref="monocle3")
Load Garnett
After installation, test that Garnett installed correctly by opening a new R session and typing:
library(garnett)Getting help
Questions about Garnett should be posted on our Google Group. Please do not email technical questions to Garnett contributors directly.
Garnett overview
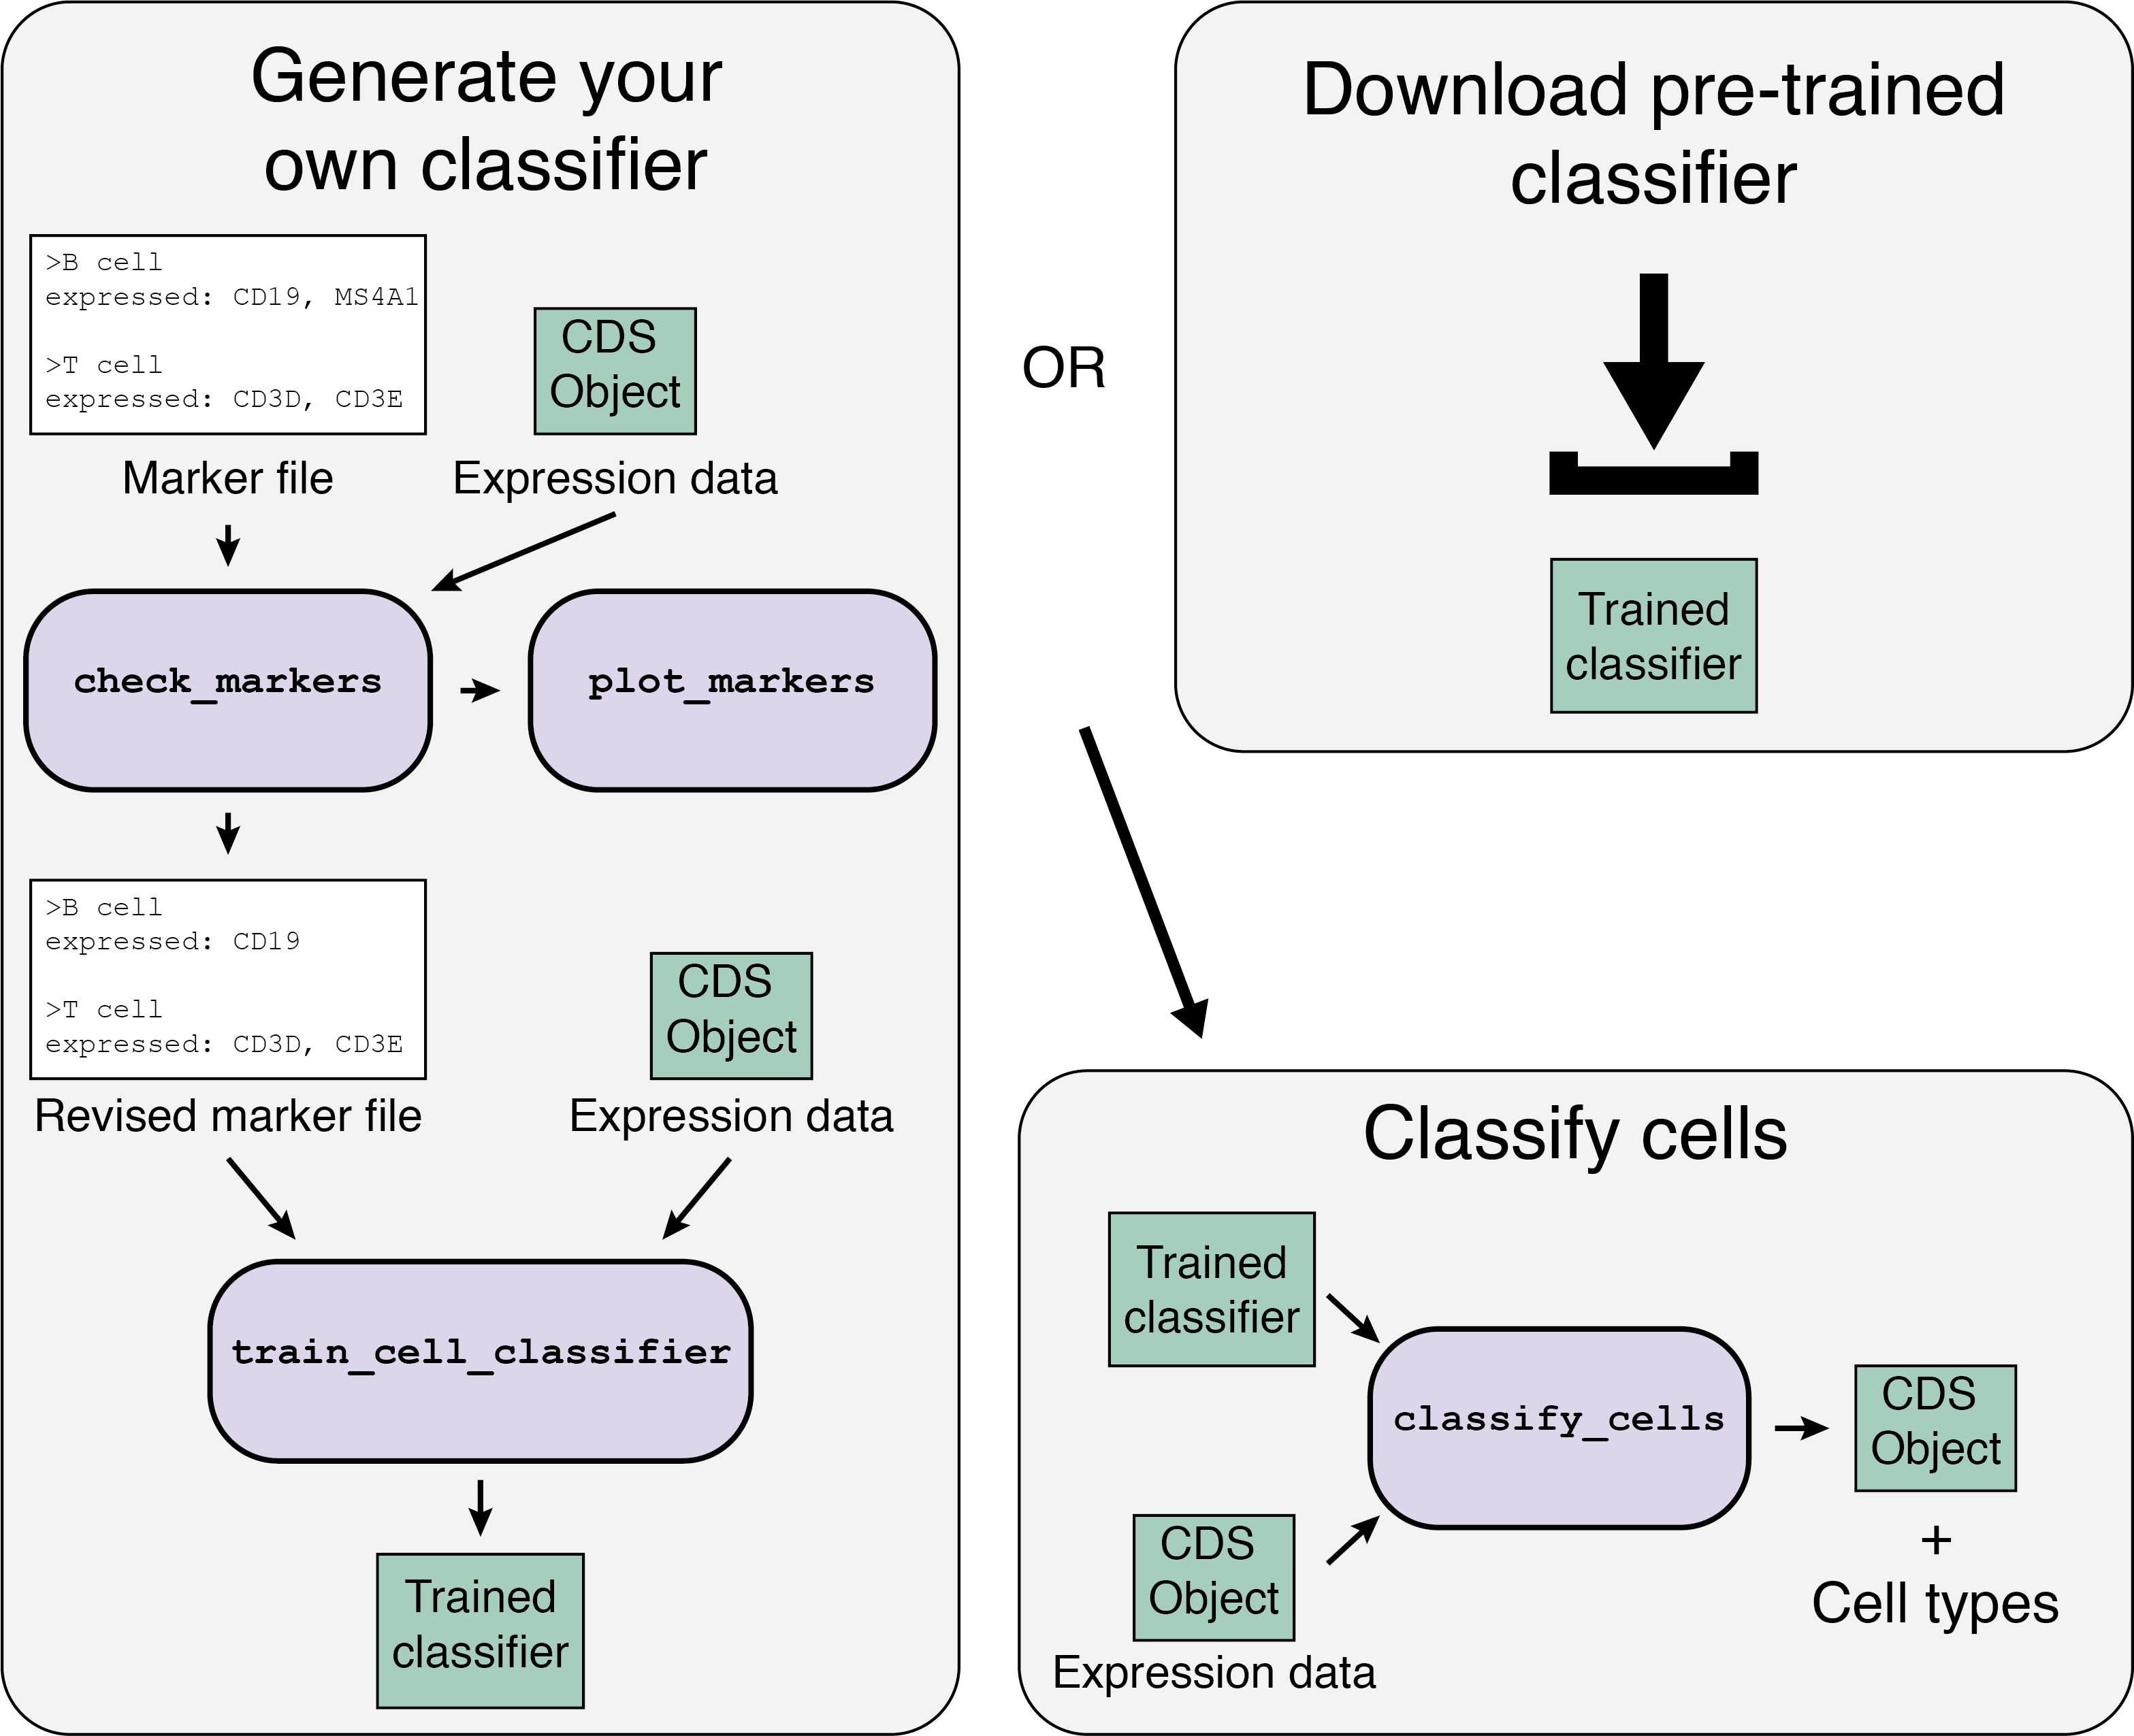
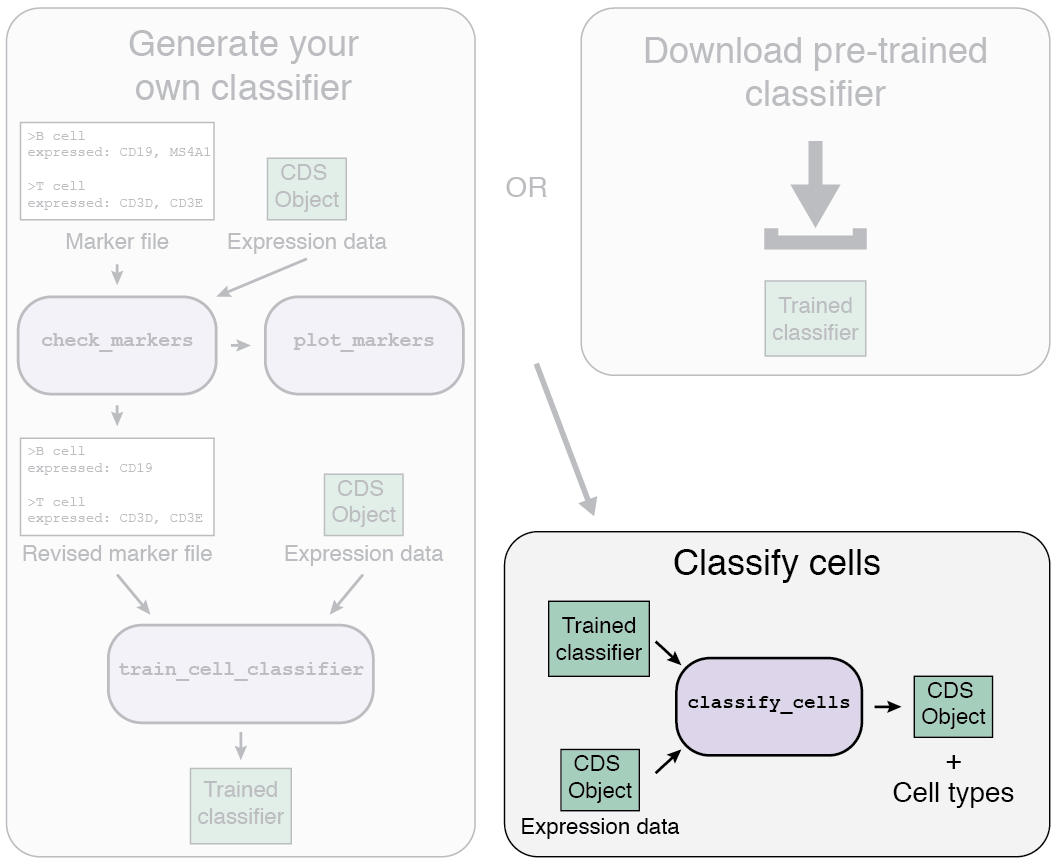
The Garnett workflow has two major parts, each described in detail below:
- Train/obtain the classifier: Either download an existing classifier, or train your own. To train, Garnett parses a marker file, chooses a set of training cells, and then trains a multinomial classifier to distinguish cell types.
- Classify cells: Next, Garnett applies the classifier to a set of cells to generate cell type assignments. Optionally, Garnett will expand classifications to similar cells to generate a separate set of cluster-extended type assignments.
1a. Using a pre-trained classifier
There are two options for the first part of the Garnett workflow: using a pre-trained classifier, or generating your own classifier.
We have generated a series of pre-trained classifiers for various organisms and tissues. If a pre-trained classifier exists for your data type, we recommend you try it. The list of available classifiers can be found here. We hope to continually update and add new classifiers as we generate them. We also accept classifiers generated by others - please submit any classifiers you make and help build the community! Details on how to submit your classifier are can be found here.
To use a pre-trained classifier, first download the classifier, and then load it into your R session using:
classifier <- readRDS("path/to/classifier.RDS")Once you've loaded the classifier, go on to part 2, Classifying your cells
1b. Train your own classifier
If a classifier doesn't exist for your tissue type, or doesn't include the cell types you expect in your data, then you'll need to generate your own.
Loading your data
The first step to train your classifier is to load your single-cell data.
The cell_data_set class
Because Garnett builds on Monocle 3, data for
Garnett is held in objects of the cell_data_set (CDS) class. This class is derived from the
Bioconductor SingleCellExperiment class, which provides a common interface familiar to those
who have analyzed single-cell data with Bioconductor. Monocle 3 provides detailed documentation about how
to generate an input CDS
here.
As an example, Garnett includes a small dataset derived from the PBMC 10x V1 expression data [1].
# load in the data
# NOTE: the 'system.file' file name is only necessary to read in
# included package data
#
mat <- Matrix::readMM(system.file("extdata", "exprs_sparse.mtx", package = "garnett"))
fdata <- read.table(system.file("extdata", "fdata.txt", package = "garnett"))
pdata <- read.table(system.file("extdata", "pdata.txt", package = "garnett"),
                    sep="\t")
row.names(mat) <- row.names(fdata)
colnames(mat) <- row.names(pdata)

# create a new CDS object
pbmc_cds <- new_cell_data_set(as(mat, "dgCMatrix"),
                              cell_metadata = pdata,
                              gene_metadata = fdata)
Constructing a marker file
Besides the expression data, the second major input you'll need is a marker file. The marker file contains a list of cell type definitions written in an easy-to-read text format. The cell type definitions tell Garnett how to choose cells to train the model on. Each cell type definition starts with a '>' symbol and the cell type name, followed by a series of lines with definition information. Definition lines start with a keyword and a ':' and entries are separated by a comma. Note: the Garnett syntax allows for entries following the ':' to move onto following lines however, you may not move to a new line mid entry (i.e. you can go to a new line only after a comma).
A simple valid example:
>B cells
expressed: CD19, MS4A1

>T cells
expressed: CD3D
There are several ways to define cell types in the Garnett marker file format. In general, each cell's definition can have three major components. Only the first component is required.
Define the expression
The first and most important specification for a cell type is its expression. Garnett offers several options for specifying marker genes, detailed below.
Recommended expression specifications
| Format | Example |
|---|---|
expressed: gene1, gene2 |
expressed: MYOD1, MYH3 |
not expressed: gene1, gene2 |
not expressed: PAX6, PAX3 |
This is the default way to specify marker genes for your cell types. When using this specification, Garnett
calculates a marker score for each cell, accounting for potential leakage, overall expression levels, and read
depth. expressed: markers should be specific to the cell type being defined.
Alternative expression specifications
| Format | Example |
|---|---|
expressed above: gene1 value, gene2 value |
expressed above: MYOD1 4.2, MYH3 700 |
expressed below: gene1 value, gene2 value |
expressed below: PAX6 20, PAX3 4 |
expressed between: gene1 value1 value2, gene2 value1 value2 |
expressed between: PAX6 10 20, PAX3 4 100 |
This is an alternative way to specify expression, which can be useful if you know an exact range you expect the expression of a gene to occupy. In general however, we do not recommend using these specifications because they will not account for read depth and overall expression in each cell. Values are in the same units as your input data.
Define the meta data
In addition to expression information, you can further refine your cell type definitions using meta data. This is also where you will specify any subtypes you expect in your data.
Meta data specifications
| Format | Example |
|---|---|
subtype of: celltype |
subtype of: T cells |
custom meta data: attribute1, attribute2 |
tissue: spleen, thymus |
subtype of: allows you to specify that a cell type is a subtype of another cell type in your
definition file.
custom meta data: specification allows you to provide any further meta data requirements for your
cell type. Any column in the pData table of your CDS object can be used as a meta data
specification. In the example above, there would be a column in the pData table called "tissue".
Provide your evidence
Lastly, we highly recommend that you document how you chose your marker definitions. To make it easier to keep
track of, we provide an additional specification - references: - that will store your citation
information for each cell type. Add a set of URLs or DOIs and they will be included in your classifier. See
here for functions to get access to this information.
Add any comments
Similar to R code, we have included a comment character # so you can add notes/comments in your
marker file. Anything after a # on the same line will be ignored by Garnett.
A more complex example:
>B cells
expressed: CD19, MS4A1
expressed above: CD79A 10
references: https://www.abcam.com/primary-antibodies/b-cells-basic-immunophenotyping,
10.3109/07420528.2013.775654

>T cells
expressed: CD3D
sample: blood # A meta data specification

>Helper T cells
expressed: CD4
subtype of: T cells
references: https://www.ncbi.nlm.nih.gov/pubmed/?term=12000723
Warning for Windows users:
Checking your markers
Because defining the marker file is often the hardest part of the process, Garnett includes functions to check
whether your markers are likely to work well. The two functions relevant are check_markers and
plot_markers. check_markers generates a table of information about your markers and
plot_markers plots the most relevant information.
In addition to the small included dataset, we have included two example marker files with the package. Here are the contents of "pbmc_bad_markers.txt"
>B cells
expressed: CD19, MS4A1, CD79A, ACTN, ACTB
references: https://www.ncbi.nlm.nih.gov/pubmed/?term=23688120,
https://www.ncbi.nlm.nih.gov/pubmed/?term=21149806

>T cells
expressed: CD3D, CD3E, CD3G, PTPRC
references: https://www.ncbi.nlm.nih.gov/pubmed/?term=1534551

>CD4 T cells
expressed: CD4, FOXP3, IL2RA, IL7R
subtype of: T cells

>CD8 T cells
expressed: CD8A, CD8B
subtype of: T cells
Besides the CDS object and the path to the marker file, there are a few arguments to add:
db:dbis a required argument for a Bioconductor AnnotationDb-class package used for converting gene IDs. For example, for humans use org.Hs.eg.db. See available packages at the Bioconductor website. Load your chosen db usinglibrary(db). If your species does not have an AnnotationDb-class package, see here.cds_gene_id_type: This argument tells Garnett the format of the gene IDs in your CDS object. It should be one of the values incolumns(db). The default is "ENSEMBL".marker_file_gene_id_type: Similarly to above, this argument tells Garnett the format of the gene IDs in your marker file.
plot_markers to view the results.
library(org.Hs.eg.db)
marker_file_path <- system.file("extdata", "pbmc_bad_markers.txt",
                                package = "garnett")
marker_check <- check_markers(pbmc_cds, marker_file_path,
                              db=org.Hs.eg.db,
                              cds_gene_id_type = "SYMBOL",
                              marker_file_gene_id_type = "SYMBOL")

plot_markers(marker_check)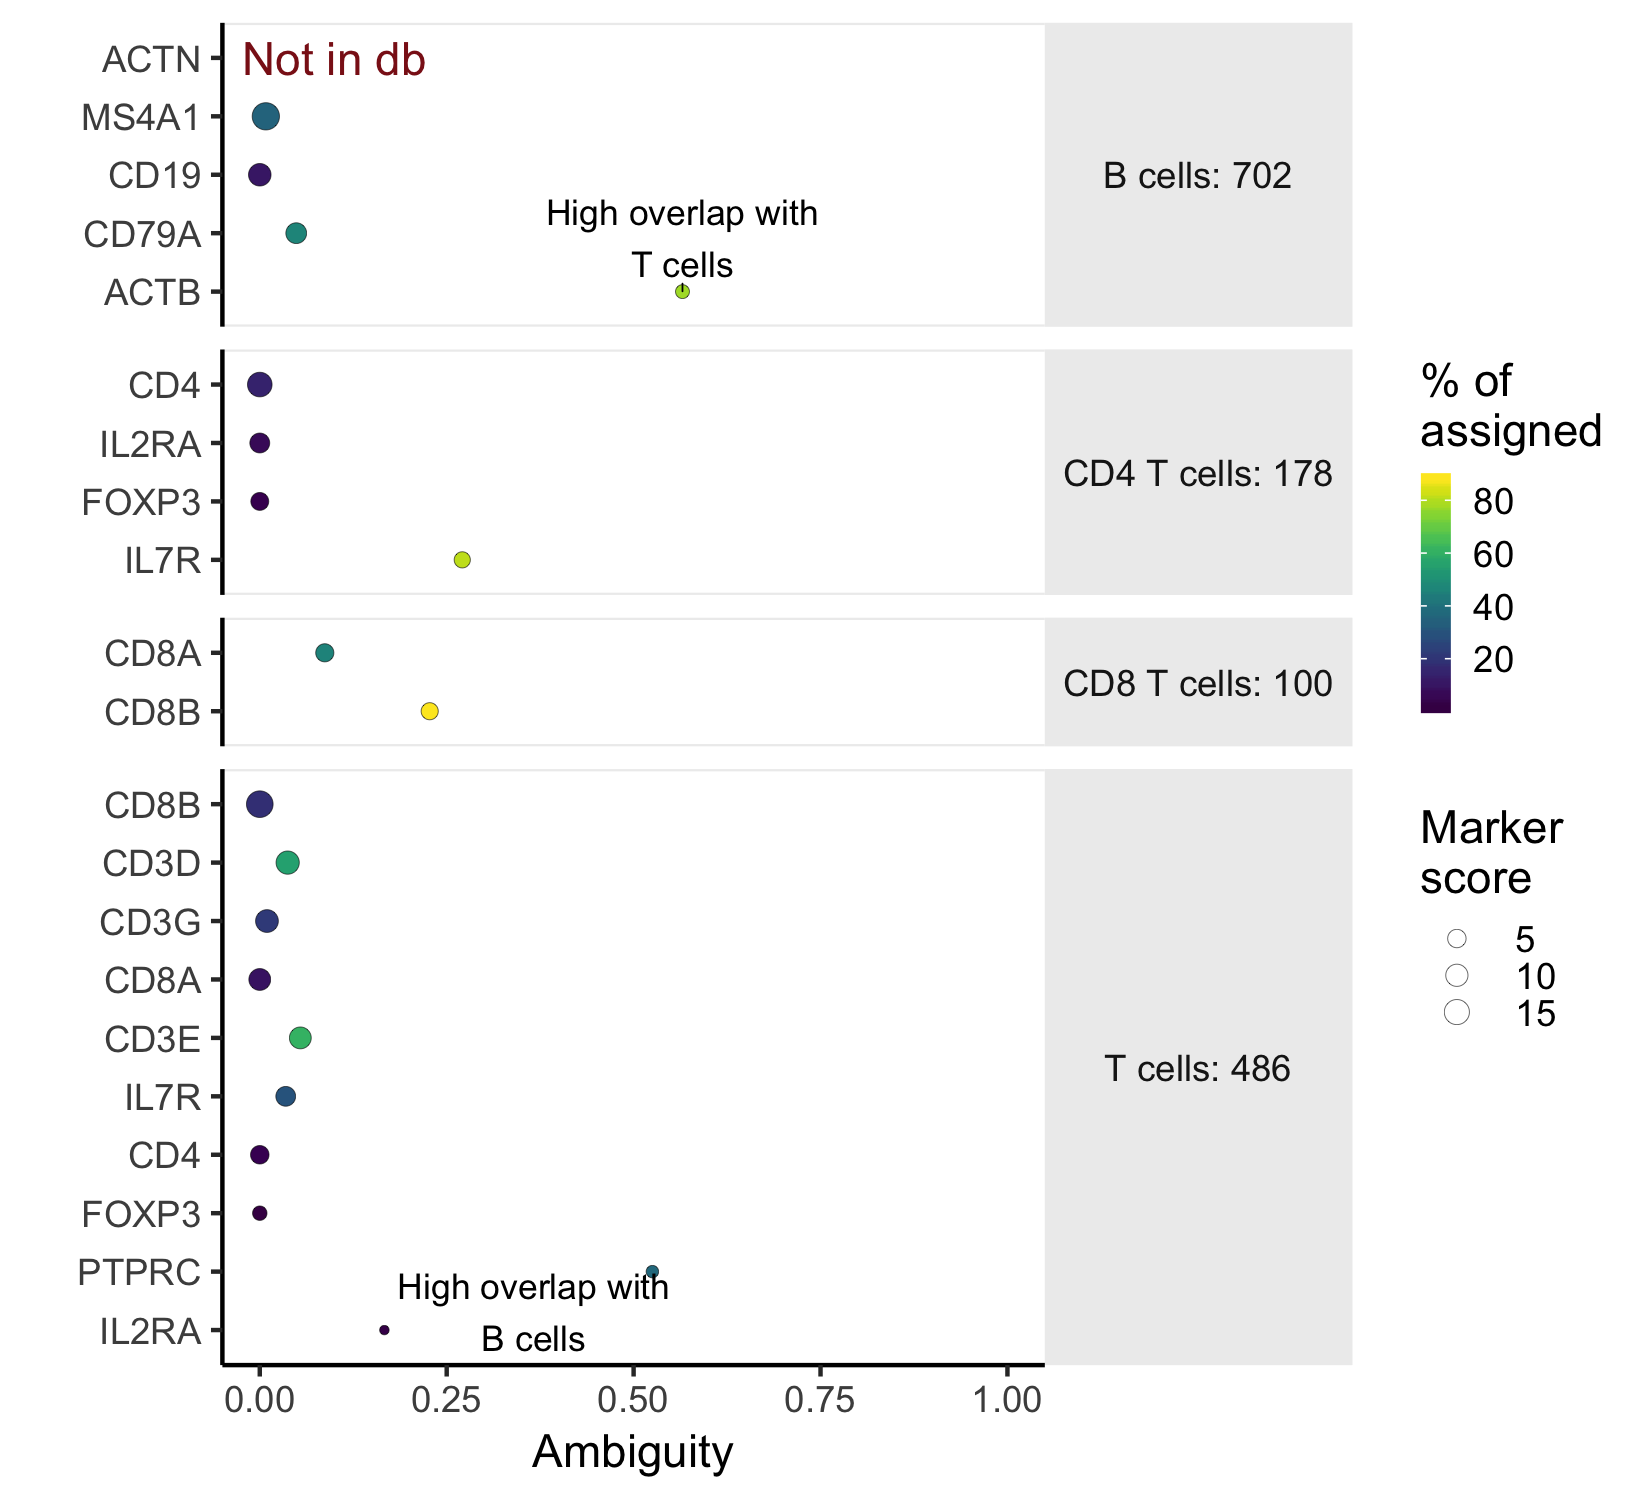
This marker plot provides some key information about whether the chosen markers are good. First, The red note 'not in db' lets us know that the marker ACTN was not present as a 'SYMBOL' in the org.Hs.eg.db annotation. In this case, it's a typo. Next, the x-axis shows the ambiguity score for each of the markers - a measure of how many cells receive ambiguous labels when this marker is included - in this case, ACTB and PTPRC have high ambiguity and should be excluded. The last piece of relevant information is what percent of all the cells nominated in a cell type were chosen because of that marker. This is indicated by color.
NOTE: The values output by check_markers and plotted by plot_markers
are estimates of the numbers of cells that could be chosen by the classifier.
However, it uses heuristics to quickly find candidate cells, and will not exactly match the cells that are chosen
by the marker. Please use the numbers as relative measures, rather than absolute representations of the training
set.
A further note on ambiguity scores: Ambiguity scores are the fraction of the cells a marker nominates that a become labeled as "Ambiguous" when that marker is included in the marker file. However, a high ambiguity score does not necessarily mean that a given marker is not specific. It could mean that a different marker is the culprit, but that marker also nominates a lot of otherwise unlabeled cells (high nomination rate). Look closely at both the marker with a high ambiguity score, and markers in the cell type that it is most ambiguous with before deciding which marker to exclude.
After making a marker plot, you may want to revise your marker file. In our toy example, we'll remove ACTN, ACTB and PTPRC to get our final 'pbmc_test.txt' marker file.
#pbmc_test.txt
>B cells
expressed: CD19, MS4A1, CD79A
references: https://www.ncbi.nlm.nih.gov/pubmed/?term=23688120, https://www.ncbi.nlm.nih.gov/pubmed/?term=21149806

>T cells
expressed: CD3D, CD3E, CD3G
references: https://www.ncbi.nlm.nih.gov/pubmed/?term=1534551

>CD4 T cells
expressed: CD4, FOXP3, IL2RA, IL7R
subtype of: T cells

>CD8 T cells
expressed: CD8A, CD8B
subtype of: T cells
No ENSEMBL in your db
classifier_gene_id_type
in both train_cell_classifier and check_markers to specify a different ID type. The value you
choose will be stored with the classifier, so you do not need to specify it again when classifying future datasets.
Train the classifier
Now it's time to train the classifier. The arguments should be pretty close to those for check_markers.
The one parameter I am changing from default below is the num_unknown argument. This tells Garnett
how many outgroup cells it should compare against. The default is 500, but in this toy dataset with so few cells
we want fewer.
library(org.Hs.eg.db)
set.seed(260)

marker_file_path <- system.file("extdata", "pbmc_test.txt",
                                package = "garnett")
pbmc_classifier <- train_cell_classifier(cds = pbmc_cds,
                                         marker_file = marker_file_path,
                                         db=org.Hs.eg.db,
                                         cds_gene_id_type = "SYMBOL",
                                         num_unknown = 50,
                                         marker_file_gene_id_type = "SYMBOL")
After running train_cell_classifier, the output object, of type "garnett_classifier" contains all of the information necessary to classify cells.
Viewing the classification genes
Garnett classification is trained using a multinomial elastic-net regression. This means that certain genes are chosen as the relevant genes for distinguishing between cell types. Which genes are chosen may be of interest, so Garnett includes a function to access the chosen genes. Note: Garnett does not regularize the input markers, so they will be included in the classifier regardless.
The function we use to see the relevant genes is get_feature_genes. The arguments are the
classifier, which node you'd like to view (if your tree is hierarchical) - use "root" for the top node and the
parent cell type name for other nodes, and the db for your species. The function will
automatically convert the gene IDs to SYMBOL if you set
convert_ids = TRUE.
feature_genes <- get_feature_genes(pbmc_classifier,
                                   node = "root",
                                   db = org.Hs.eg.db)
head(feature_genes)

#                B cells       T cells      Unknown
#(Intercept) -6.51829349  2.6403157858  3.877977704
#CD74         0.04660324 -0.0529185035  0.006315261
#MS4A1        2.42667982 -2.2194139450 -0.207265871
#CD19         4.33990156 -2.4210500042 -1.918851560
#CD79A        1.09667783 -0.7008461805 -0.395831654
#IGLL5       -0.00103241 -0.0001045559  0.001136966
Viewing references
We explained above how to include documentation about
how you chose your markers in your marker file. In order to get this information back out - to see how markers
were chosen for an already trained classifier - use the function get_classifier_references. Besides
the classifier, there is one additional optional argument called cell_type. If you pass the name
of a cell type, only the references for that cell type will be printed, otherwise they will all be printed.
get_classifier_references(pbmc_classifier)

#$`B cells`
#[1] "https://www.ncbi.nlm.nih.gov/pubmed/?term=23688120" "https://www.ncbi.nlm.nih.gov/pubmed/?term=21149806"

#$`T cells`
#[1] "https://www.ncbi.nlm.nih.gov/pubmed/?term=1534551"
Submitting a classifier
We encourage you to submit your high quality classifiers to us so we can make them available to the community. To do this, open a special issue and fill out the form in the Garnett github repository. Click here and click the "New issue" button to get started!
1c. Train a marker-free classifier
Warning - Alpha Feature:
If a classifier doesn't exist for your tissue type, but there exists an additional dataset from the same tissue and organism with known cell types, then you can train a classifier on this dataset to apply to any future data without providing marker genes by using the marker-free method.
To use marker-free classifier training, follow all of the steps above for creating your own classifier, but provide a marker-free cell type definition file as described below:
Constructing a marker-free cell type definition file
As described above, the Garnett marker file contains a list of cell type definitions written in an easy-to-read text format. The cell type definitions tell Garnett how to choose cells to train the model on. Each cell type definition starts with a '>' symbol and the cell type name, followed by a series of lines with definition information. Definition lines start with a keyword and a ':' and entries are separated by a comma.
In the case of the marker-free cell type definition file, instead of providing marker gene information, you will instead provide alternative definition information which corresponds to a column in your cell metadata (colData/pData). For example, if I have a column in my colData table called "known_type", then I can use definitions there to generate cell type definitions.
>B cells
known_type: B cells

>T cells
known_type: T cells
Marker-free cell type definition allows nested cell types, for example, another valid marker file would be:
>B cells
known_type: B cells

>T cells
known_type: T cells

>CD4 T cells
known_sub_type: CD4 T cells
subtype of:  T cells

>CD8 T cells
known_sub_type: CD8 T cells
subtype of: T cells
Lastly, some cell types can be defined by gene expression as above while others are defined without markers. However please note that at present, cell types defined marker-free cannot also include expression markers. In the case that both an expression marker and a marker-free definition are included in the same cell type definition, the marker-free tag will be treated as additional metadata (see above) rather than as a marker-free definition. See below for and example of a valid marker file with some cell types defined using expression and others defined marker-free:
>B cells
known_type: B cells

>T cells
known_type: T cells

>CD4 T cells
expressed: CD4
subtype of:  T cells

>CD8 T cells
expressed: CD8A, CD8B
subtype of: T cells
Training example using marker-free cell type definitions
Using the example cell type definition file from above:
library(org.Hs.eg.db)
set.seed(260)

head(pData(pbmc_cds))
#                     tsne_1    tsne_2 Size_Factor FACS_type
# AAGCACTGCACACA-1  3.840315 12.084191   0.5591814   B cells
# GGCTCACTGGTCTA-1  9.970962  3.505393   0.5159340   B cells
# AGCACTGATATCTC-1  3.459529  4.935273   0.6980284   B cells
# ACACGTGATATTCC-1  1.743949  7.782671   0.8156310   B cells
# ATATGCCTCTGCAA-1  5.783448  8.558898   1.1153280   B cells
# TGACGAACCTATTC-1 10.792853 10.585274   0.6494699   B cells

# Add the columns needed for the example:
pData(pbmc_cds)$known_type <- ifelse(pData(pbmc_cds)$FACS_type == "B cells", "B cells", "T cells")

marker_file_path <- system.file("extdata", "pbmc_marker_free_test.txt",
                                package = "garnett")
pbmc_classifier <- train_cell_classifier(cds = pbmc_cds,
                                         marker_file = marker_file_path,
                                         db=org.Hs.eg.db,
                                         cds_gene_id_type = "SYMBOL",
                                         num_unknown = 50,
                                         marker_file_gene_id_type = "SYMBOL")
After running train_cell_classifier, the output object, of type "garnett_classifier" contains all of the information necessary to classify cells.
2. Classifying your cells
Load your data
If you haven't loaded your data yet (because you're using a pre-trained classifier), now is the time!
The cell_data_set class
Because Garnett builds on Monocle 3, data for
Garnett is held in objects of the cell_data_set (CDS) class. This class is derived from the
Bioconductor SingleCellExperiment class, which provides a common interface familiar to those
who have analyzed single-cell data with Bioconductor. Monocle 3 provides detailed documentation about how
to generate an input CDS
here.
As an example, Garnett includes a small dataset derived from the PBMC 10x V1 expression data [1].
# load in the data
# NOTE: the 'system.file' file name is only necessary to read in
# included package data
#
mat <- Matrix::readMM(system.file("extdata", "exprs_sparse.mtx", package = "garnett"))
fdata <- read.table(system.file("extdata", "fdata.txt", package = "garnett"))
pdata <- read.table(system.file("extdata", "pdata.txt", package = "garnett"),
                    sep="\t")
row.names(mat) <- row.names(fdata)
colnames(mat) <- row.names(pdata)

# create a new CDS object
pbmc_cds <- new_cell_data_set(as(mat, "dgCMatrix"),
                              cell_metadata = pdata,
                              gene_metadata = fdata)
Once you've got your classifier, it's time to classify your cells using the classify_cells
function! The key arguments are:
cds: This is the CDS object containing your gene expression data (see above).classifier: This the the garnett_classifier you obtained above.db:dbis a required argument for a Bioconductor AnnotationDb-class package used for converting gene IDs. For example, for humans use org.Hs.eg.db. See available packages at the Bioconductor website. Load your chosen db usinglibrary(db). If your species does not have an AnnotationDb-class package, see here.cluster_extend: This tells Garnett whether to create a second set of assignments that expands classifications to cells in the same cluster. You can either provide cluster IDs in the pData table in a column titled "garnett_cluster", or you can let Garnett calculate the clusters and populate the column.Warning: if not providing a "garnett_cluster" column and settingcluster_extendtoTRUEwith a very large dataset, this function will slow down considerably. For convenience, Garnett will save the clusters it calculates to "garnett_cluster", so the function will be faster if run again.cds_gene_id_type: This argument tells Garnett the format of the gene IDs in your CDS object. It should be one of the values incolumns(db). The default is "ENSEMBL".
classify_cells function returns the input CDS object with one (or two if
cluster_extend = TRUE) new columns in the pData table containing the Garnett
classifications.
library(org.Hs.eg.db)
pbmc_cds <- classify_cells(pbmc_cds, pbmc_classifier,
                           db = org.Hs.eg.db,
                           cluster_extend = TRUE,
                           cds_gene_id_type = "SYMBOL")


head(pData(pbmc_cds))
#                  CellSample    tsne_1    tsne_2 Size_Factor garnett_cluster cell_type cluster_ext_type
#AAGCACTGCACACA-1 CD19+BCells  3.840315 12.084191   0.5591814               1   B cells          B cells
#GGCTCACTGGTCTA-1 CD19+BCells  9.970962  3.505393   0.5159340               1   Unknown          B cells
#AGCACTGATATCTC-1 CD19+BCells  3.459529  4.935273   0.6980284               1   B cells          B cells
#ACACGTGATATTCC-1 CD19+BCells  1.743949  7.782671   0.8156310               2   B cells          B cells
#ATATGCCTCTGCAA-1 CD19+BCells  5.783448  8.558898   1.1153280               1   B cells          B cells
#TGACGAACCTATTC-1 CD19+BCells 10.792853 10.585274   0.6494699               3   B cells          B cells

table(pData(pbmc_cds)$cell_type)
# B cells CD4 T cells CD8 T cells     T cells     Unknown
#     207         129          61         164         239

table(pData(pbmc_cds)$cluster_ext_type)
# B cells CD4 T cells     T cells
#     403         190         207

library(ggplot2)

qplot(tsne_1, tsne_2, color = cell_type, data = as.data.frame(pData(pbmc_cds))) +
    theme_bw()

qplot(tsne_1, tsne_2, color = cluster_ext_type, data = as.data.frame(pData(pbmc_cds))) +
    theme_bw()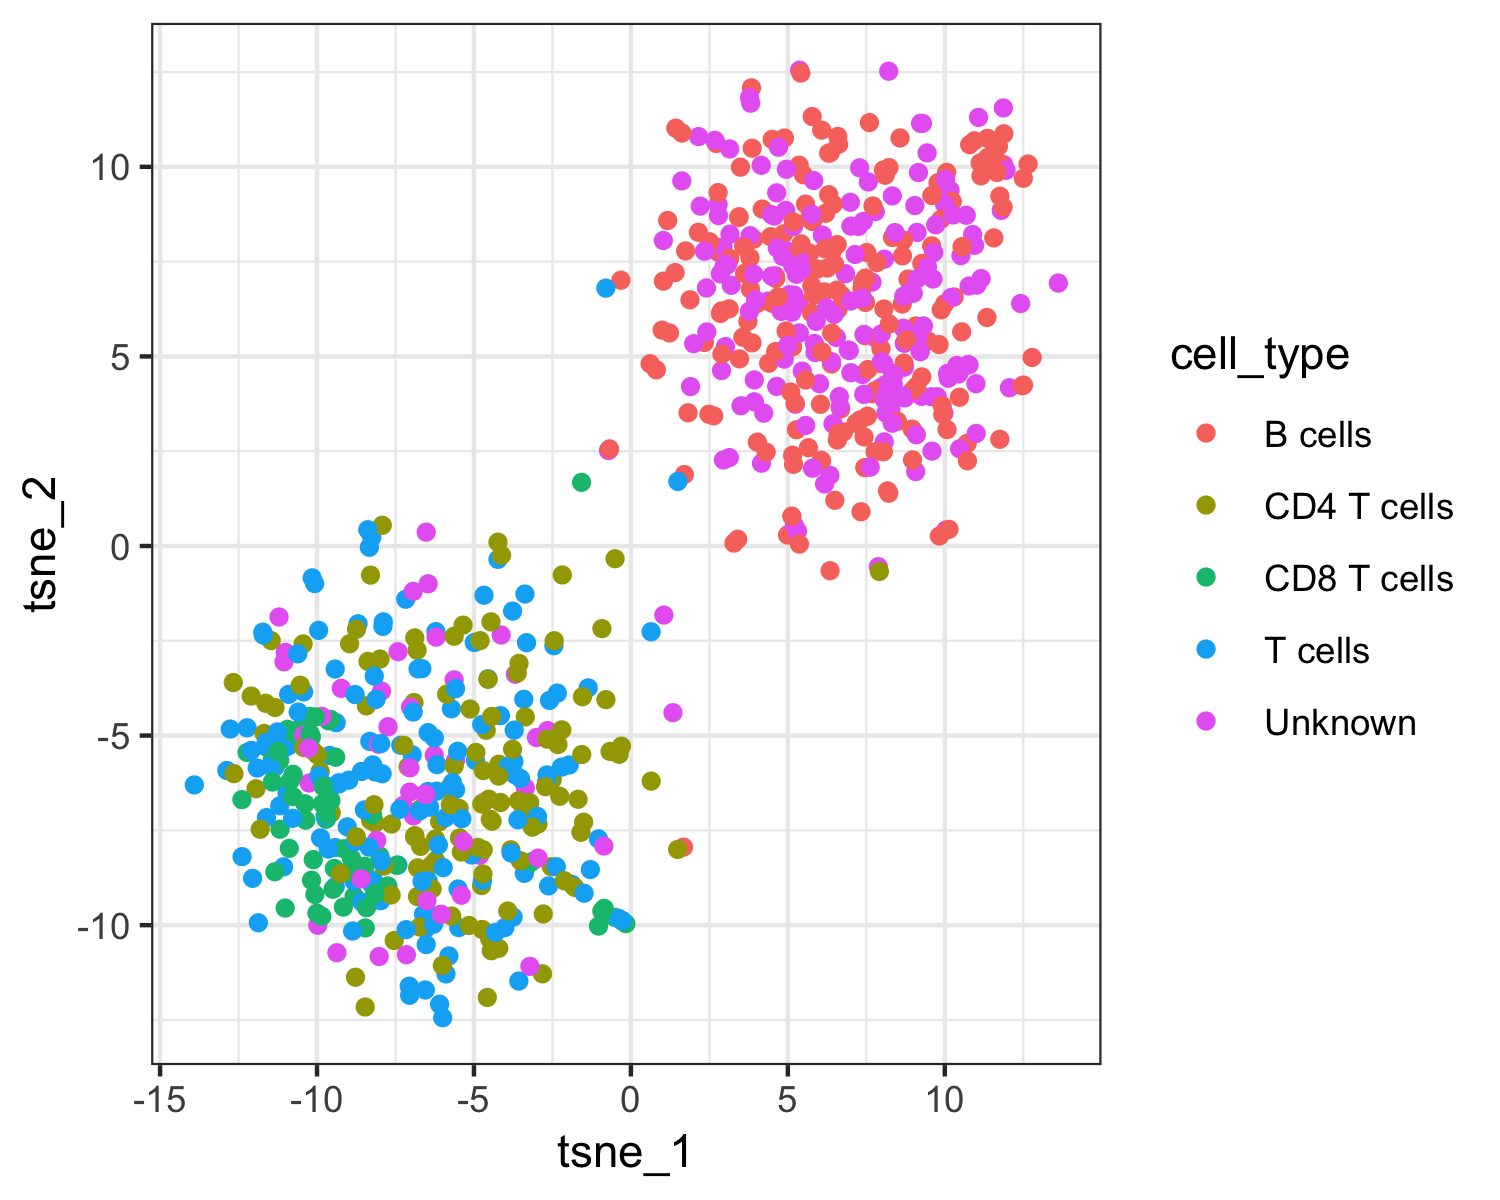
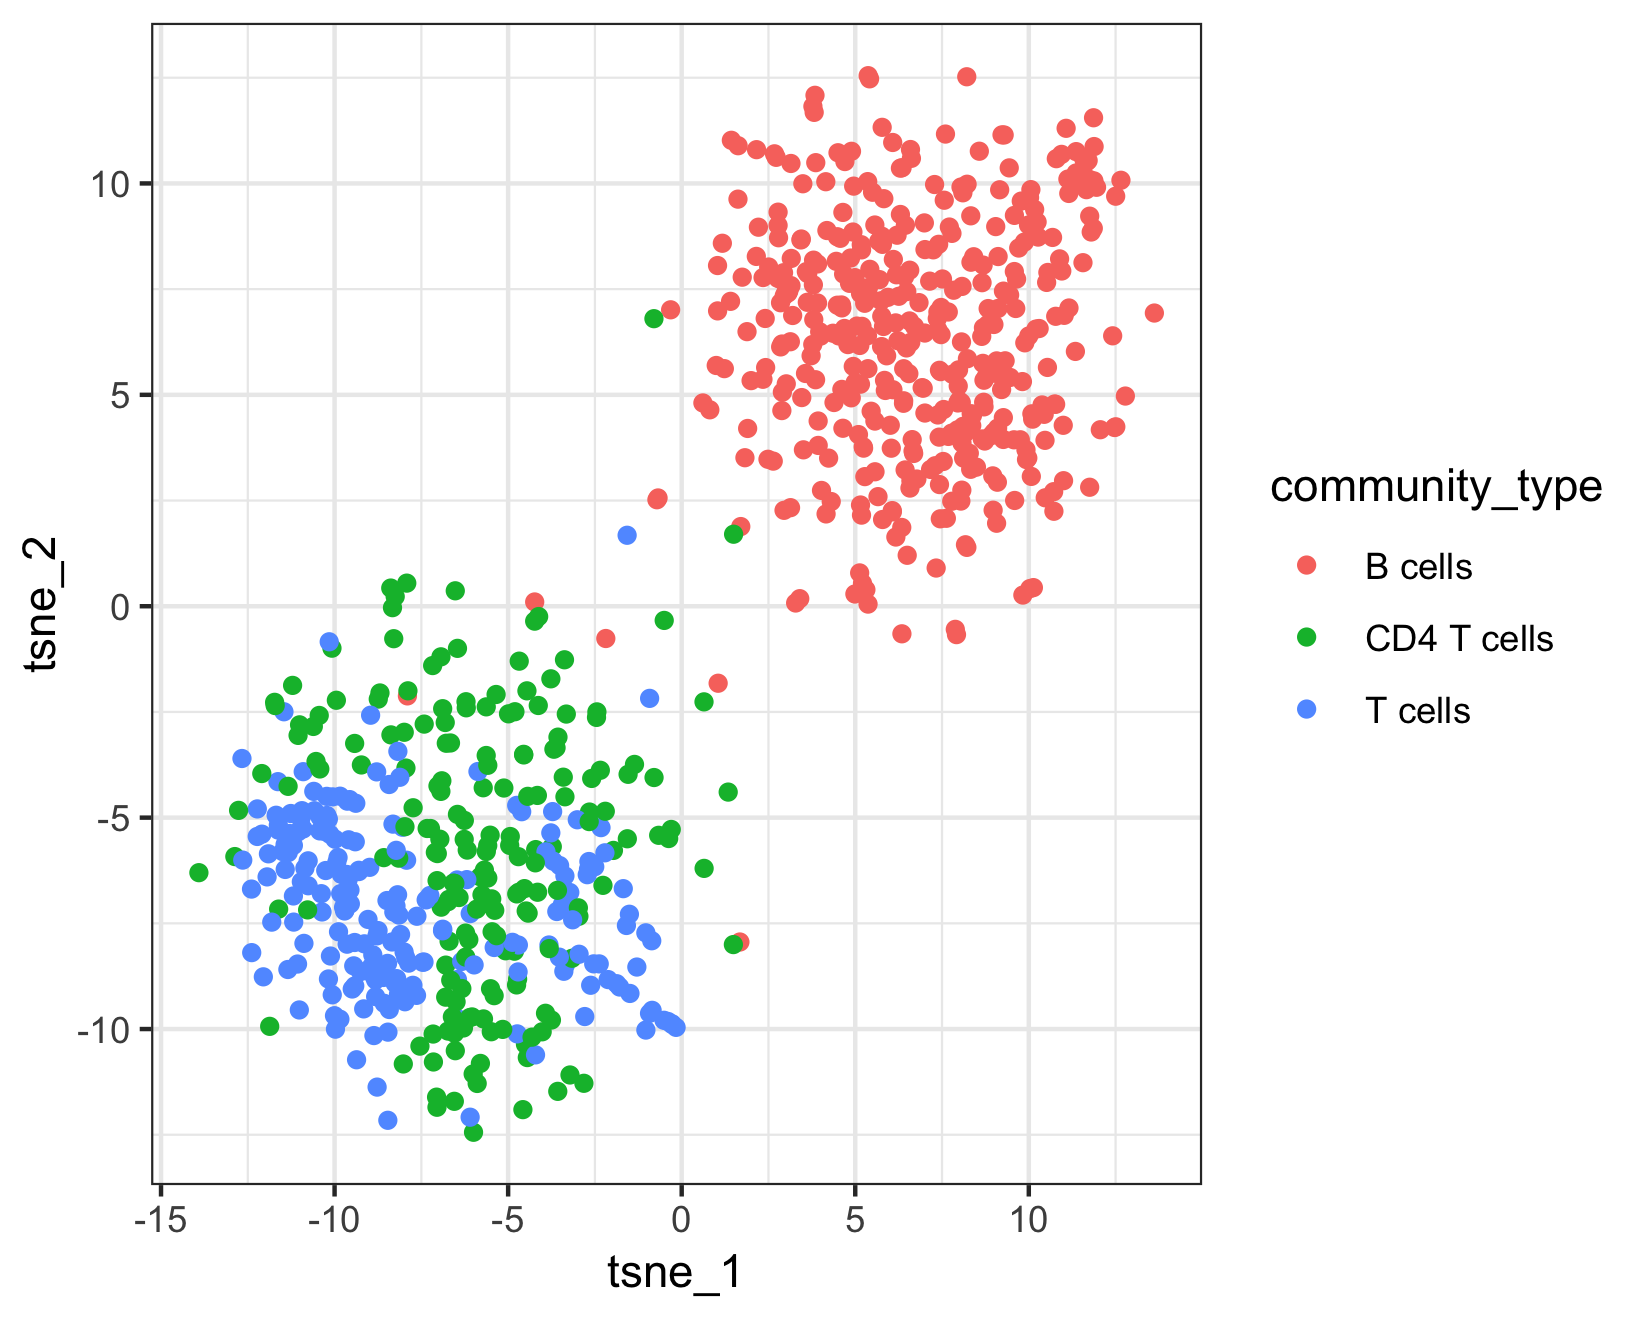
The top plot above shows Garnett's cell type assignments, and the second plot show Garnett's cluster-extended type assignments. You can see that the T cell subsets (CD4 and CD8) are not well separated in these clusters, so when the cluster-extended type is calculated, Garnett backs up the hierarchy to the more confident assignment of "T cells".
Because this example data is from a FACS sorted cell sample, we can compare Garnett's assignments to the "true" cell types.
qplot(tsne_1, tsne_2, color = FACS_type, data = as.data.frame(pData(pbmc_cds))) +
    theme_bw()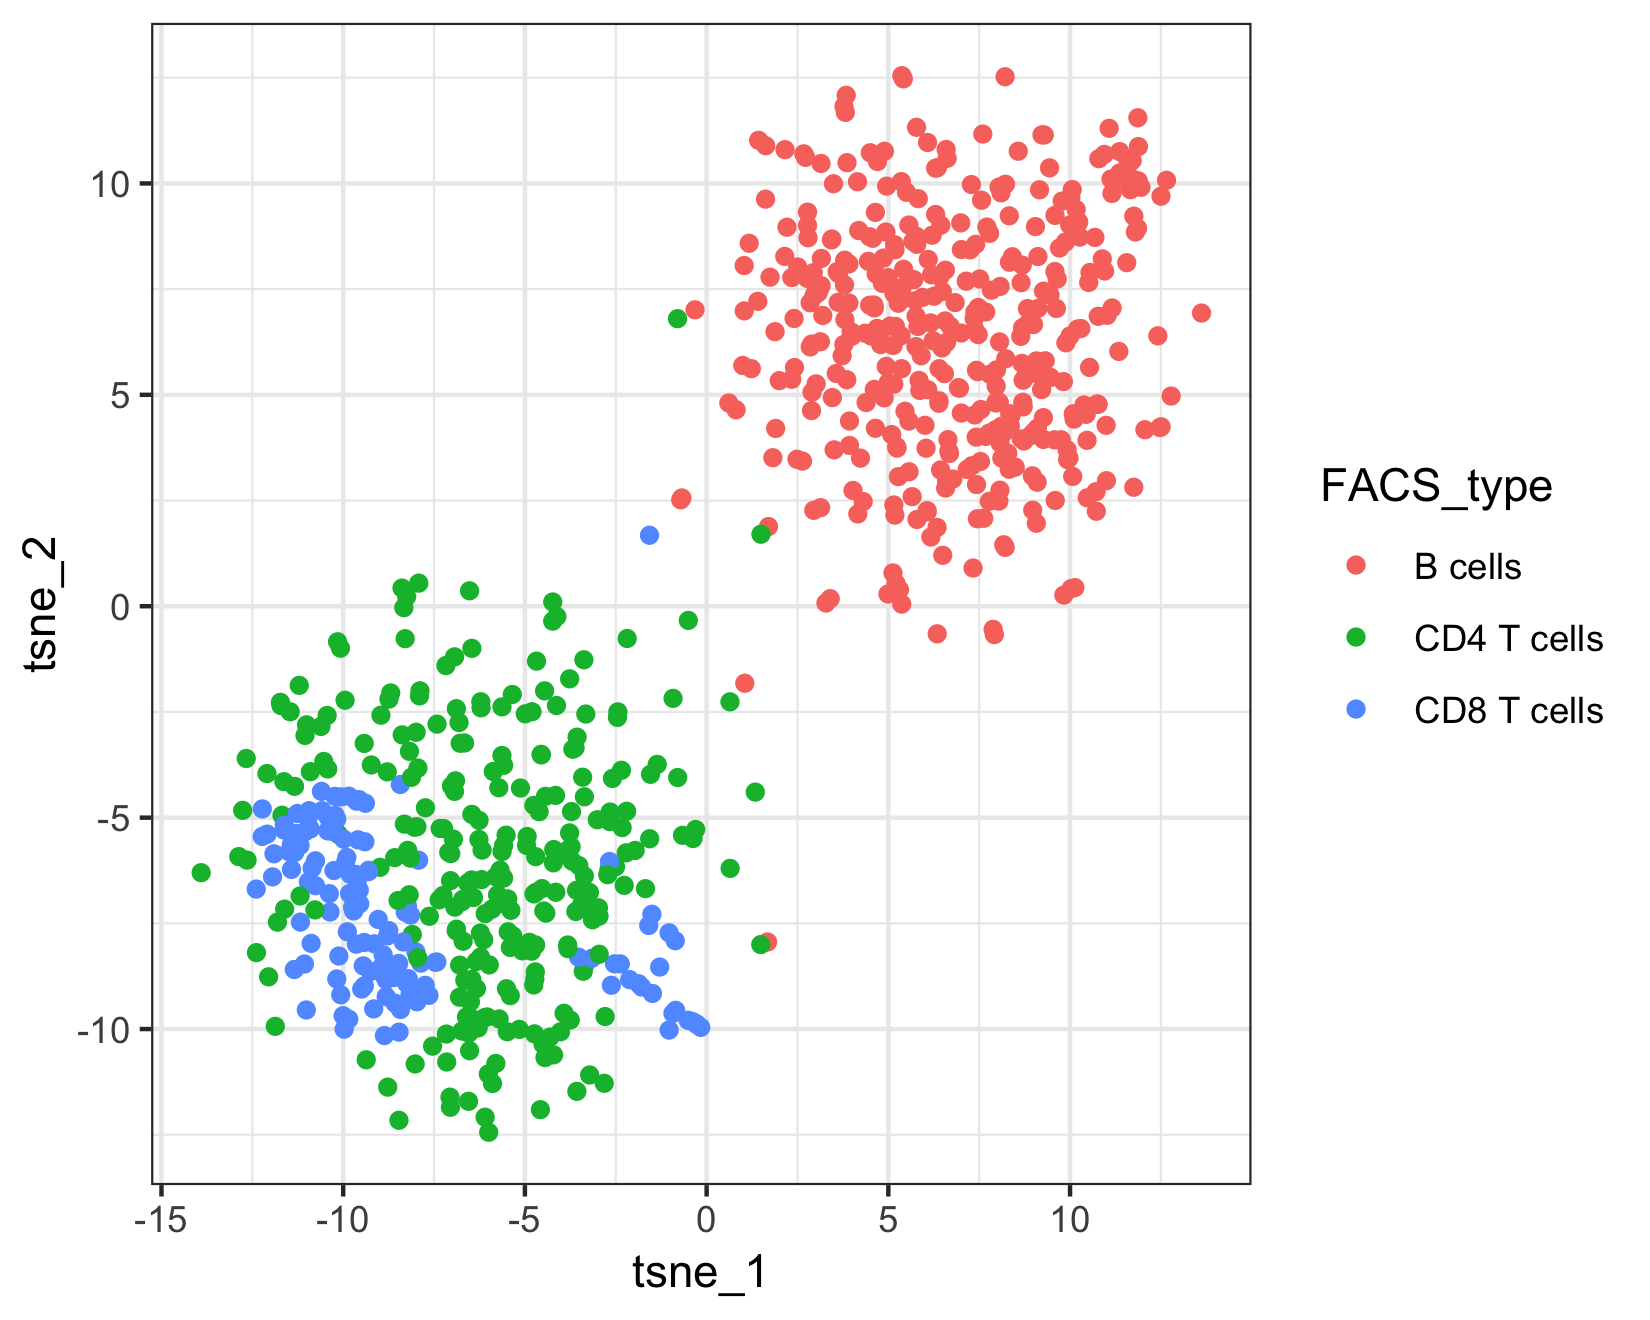
Troubleshooting
Common marker file errors
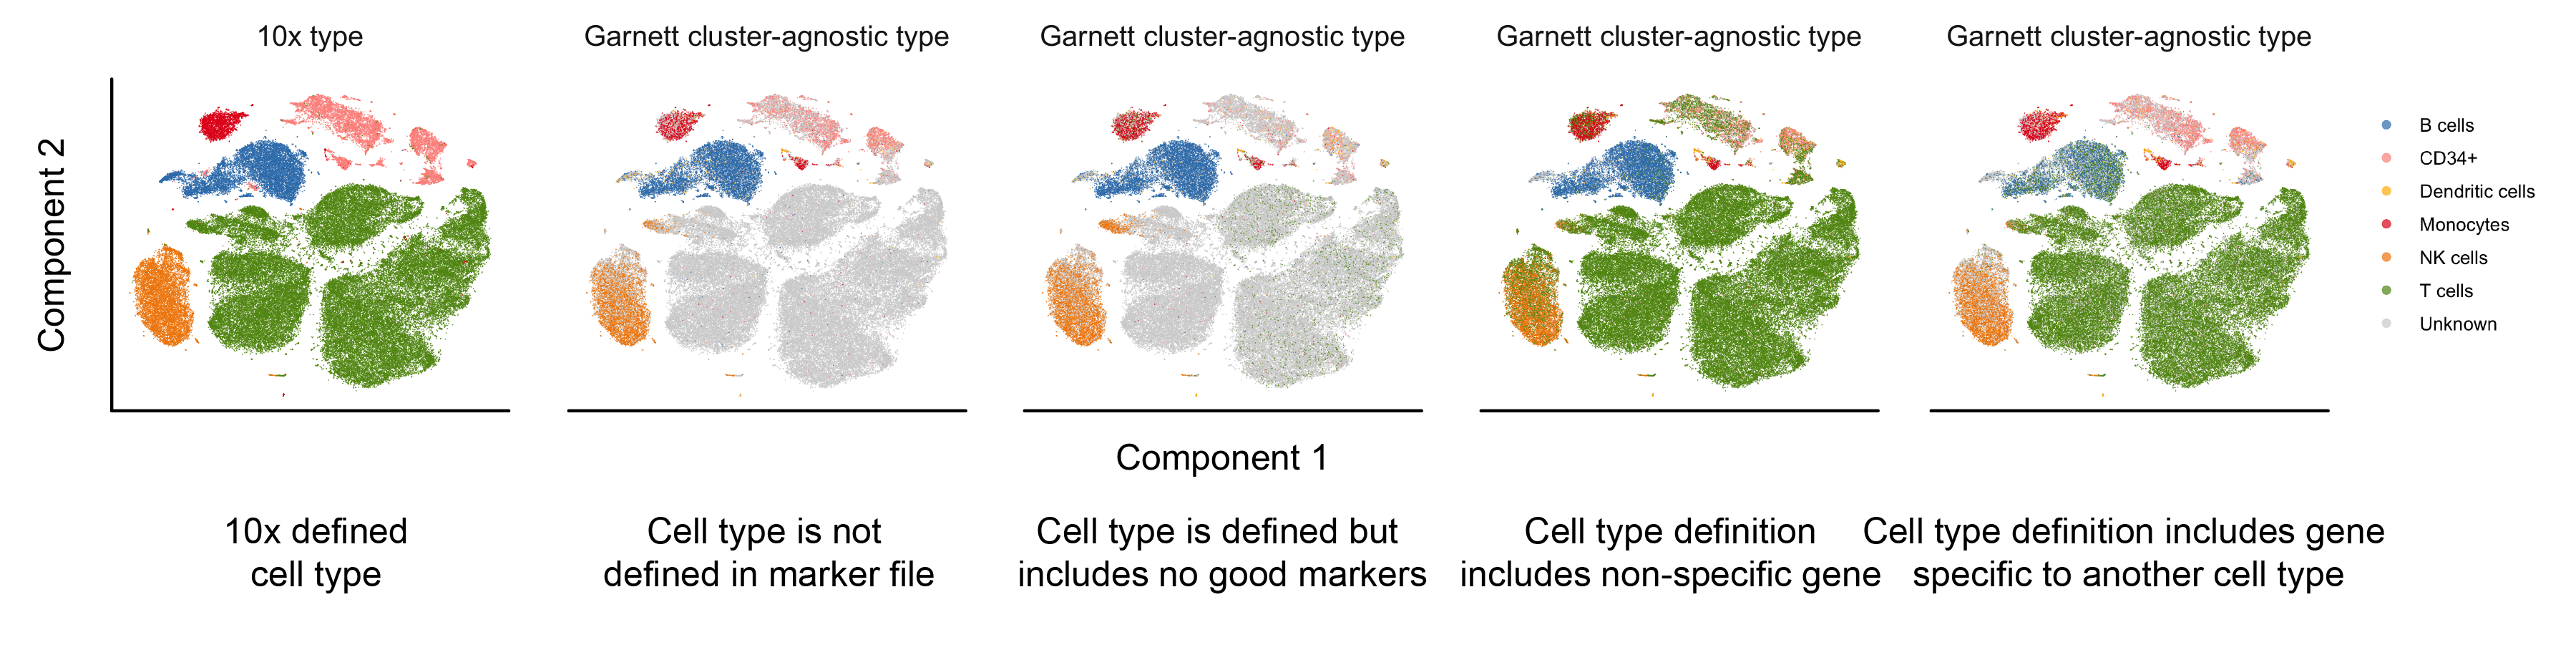
Here, we provide examples of a few of the common marker file errors and potential outcomes in Garnett's classification. For all panels, a classifier was trained on the 10x PBMC version 2 (V2) data and the classifier was then used to classify the 10x PBMC version 1 (V1) data shown above. The first panel is colored by the FACS-based 10x cell type assignments. The remaining panels are colored by the Garnett cluster-agnostic cell type assignment.
- A cell type is missing from the marker file. For example, in the PBMC marker file, not including a T cell definition (Panel 2). We found that, in general, Garnett labels the missing cell type as ‘Unknown’. The exception to this, discussed in an addition to the manuscript, is when a feature describing an existing cell type is present in missing cell type (i.e. the NKT cells that express NK marker FCGR3A.
- A cell type is defined but includes no good specific markers. For example, in the PBMC marker file, defining T cells using only CD4 and not CD3 (Panel 3). In this case, we found that Garnett labelled only a subset of the T cells as such and left the remaining cells unlabelled.
- A gene that is not specific and widely expressed is used to define a cell type. For example, if we add MALAT1 (the most expressed transcript in the PBMC dataset) to the T cell definition (Panel 4). In this case, we find that each of the cell types ends up with mixed assignments between the true cell types and T cells. In an alternative scenario, the inclusion of a widely expressed non-specific gene may cause Garnett not to find sufficient training samples at all, because it will consider all cells to be ambiguous (i.e. they will express other marker plus the non-specific one).
- A cell type definition includes genes that are specific to another cell type. This is the case where a definition is truly ‘wrong’, i.e. if the best marker for B cells (CD79A) is add to the T cell definition (Panel 5). We found that the B cell clusters gets mixed cell type assignments of B cell and T cell, but that the remaining cell types’ labels are mostly unchanged.
My species doesn't have an AnnotationDbi-class database
If your species doesn't have an available AnnotationDbi-class database, then Garnett won't be able to convert among
gene ID types. However, you can still use Garnett for classification. Set db = 'none' and then be sure
that you use the same gene ID type in your marker file as your CDS object. When db = 'none'
Garnett ignores the arguments for gene ID type.
More troubleshooting to come...
Citation
If you use Garnett to analyze your experiments, please cite:citation("garnett")
# Hannah A. Pliner, Jay Shendure & Cole Trapnell (2019). Supervised classification enables rapid annotation of cell atlases. Nature Methods
#
# A BibTeX entry for LaTeX users is
#
# @Article{,
# title = {Supervised classification enables rapid annotation of cell atlases},
# journal = {Nature Methods},
# year = {2019},
# author = {Hannah A. Pliner and Jay Shendure and Cole Trapnell},
# }
#Acknowledgements
Garnett was developed by Hannah Pliner in Cole Trapnell's and Jay Shendure's labs.Zach Pliner named the software.
This vignette was created from Wolfgang Huber's Bioconductor vignette style document, and patterned after the vignette for DESeq, by Simon Anders and Wolfgang Huber.
References
[1] G. X. Y. Zheng, J. M. Terry, P. Belgrader, P. Ryvkin, Z. W. Bent, R. Wilson, S. B. Ziraldo, T. D. Wheeler, G. P. McDermott, J. Zhu, M. T. Gregory, J. Shuga, L. Montesclaros, J. G. Underwood, D. A. Masquelier, S. Y. Nishimura, M. Schnall-Levin, P. W. Wyatt, C. M. Hindson, R. Bharadwaj, A. Wong, K. D. Ness, L. W. Beppu, H. J. Deeg, C. McFarland, K. R. Loeb, W. J. Valente, N. G. Ericson, E. A. Stevens, J. P. Radich, T. S. Mikkelsen, B. J. Hindson, J. H. Bielas, Massively parallel digital transcriptional profiling of single cells. Nat. Commun. 8, 14049 (2017). doi:10.1038/ncomms14049pmid:28091601